顯示具有 graylog 標籤的文章。 顯示所有文章

2026/03/05

今天要把graylog升到 7.0.5
竟然出現以下問題

file /usr/lib/.build-id/0f/5bf41e3e207feb6cab260b2366f1697c13555b conflicts between attempted installs of graylog-datanode-7.0.5-1.x86_64 and graylog-server-7.0.5-1.x86_64
  file /usr/lib/.build-id/2a/45eebcedc9ddddd7e43512f1c1d13a625cfe52 conflicts between attempted installs of graylog-datanode-7.0.5-1.x86_64 and graylog-server-7.0.5-1.x86_64
  file /usr/lib/.build-id/32/f8130f4d86dfcf5f9af96b1cb932eda8015165 conflicts between attempted installs of graylog-datanode-7.0.5-1.x86_64 and graylog-server-7.0.5-1.x86_64
  file /usr/lib/.build-id/3c/51e24cab713cbc44a4b05fed44660d7d8e4035 conflicts between attempted installs of graylog-datanode-7.0.5-1.x86_64 and graylog-server-7.0.5-1.x86_64
  file /usr/lib/.build-id/3d/552045a6af8c09b554b88b43d19a50b9e52b99 conflicts between attempted installs of graylog-datanode-7.0.5-1.x86_64 and graylog-server-7.0.5-1.x86_64
  file /usr/lib/.build-id/7f/0274197caa4afcc5c5430232e140211d611a4f conflicts between attempted installs of graylog-datanode-7.0.5-1.x86_64 and graylog-server-7.0.5-1.x86_64
  file /usr/lib/.build-id/db/dfd874aa078c8f1feacc28175a6a874c060d6a conflicts between attempted installs of graylog-datanode-7.0.5-1.x86_64 and graylog-server-7.0.5-1.x86_64
  file /usr/lib/.build-id/e7/189286cdb1e6c44b0968f6d52855af9696ae2c conflicts between attempted installs of graylog-datanode-7.0.5-1.x86_64 and graylog-server-7.0.5-1.x86_64

都是官方的吔 沒測試就丟出來

只能直接手動下載二個rpm

https://downloads.graylog.org/el/stable/7.0/x86_64

再來

rpm -ivh --force graylog-server-7.0.5-1.x86_64.rpm graylog-datanode-7.0.5-1.x86_64.rpm


2025/11/07

今天把另一台graylog也轉到 7 版了
目前狀況

datanode.conf 裡

opensearch_heap = 16g


目前全部ram是給32G 文件上是說要給到一半的 ram
所以
opensearch_heap 如果不調到  16G  進web介面後會有告警


/etc/sysconfig/graylog-server

以下這行最好調到 8g 如下
 
GRAYLOG_SERVER_JAVA_OPTS="-Xms8g -Xmx8g -server -XX:+UseG1GC -XX:-OmitStackTraceInFastThrow"

8G以下 buffers 很容易塞住


調整完剩下 8G 再觀察看看會不會有什麼問題

2025/11/04

graylog 7 昨天發布

比較大的改變是不再使用 opensearch 而改用 graylog-datanode

照著官方文件安裝沒什麼問題

如果是在PVE上安裝

因為 mongodb 必須使用到cpu的 avx 功能

所以cpu type 至少要選 x86-64-v3 以上

這個在graylog 5 安裝時就有這個要求了

特別要注意的是以下流程跟之前不同

安裝完後必須 cat /var/log/graylog-server/server.log

找到首次進入系統的帳號密碼及連結

如下範例
http://admin:ghWgeIAkKl@10.0.0.1:9000

按照畫面上的流程步驟 使用預設值一直下一步即可

目前先把netflow轉到新版了 觀察一陣子看看


https://go2docs.graylog.org/current/setting_up_graylog/web_interface.htm#Prefligh

https://graylog.org/

https://go2docs.graylog.org/current/downloading_and_installing_graylog/red_hat_installation.htm

2024/11/06

graylog 6版後的index rotation改成了另一種方式


原本是設定

Max. days in storage 
180

Min. days in storage
60

主觀認知是能查到60天內的資料 超過60天系統會封存 但應該還是能查到
但事實上超過60天就查不到資料了

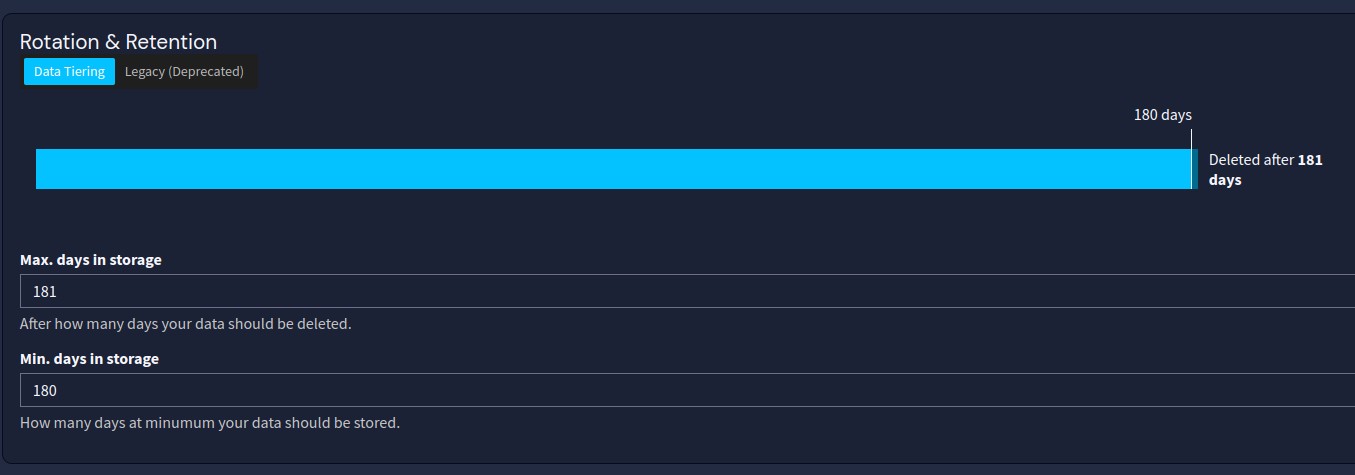
為了符合法規規定 所以現在改成

Max. days in storage 
181

Min. days in storage
180


覺得舊版的方式比較好 
能自己決定几天後就把 index close
然後再看狀況手動去砍

認真查了一下才發現graylog現在分成了三個版本

open的這個版本現在大幅減少支援的功能

為了解決以上的問題

看來只能定期手動或用crontab去close index

shell 如下

for i in {171..180}
do
        echo $i
        curl -u use:passwd -XPOST "http://10.0.0.1:9200/graylog_$i/_close"
done

目前觀察大約是每二天會 index rotate 一次 

需要查詢舊資料時再打開

curl -v -X POST -H "Content-Type: application/json" -H "X-Requested-By: XMLHttpRequest" -u user:passwd http://10.0.0.1:9000/api/system/indexer/indices/graylog_245/reopen


今天把另一台 graylog 5.2.12 轉到 graylog 6.1.1

graylog 5 預設就會有 syslog udp 514 的 input 不用再另外加

graylog 6 預設沒有 所以一定要記得加上去

漏了一段時間的 log 沒收到

2024/09/19

一直在處理almalinux 9 live migrate的問題
目前得到的結果是

使用 x86-64-v2-AES 這個cpu type 就沒有問題
而且這個type 也是 PVE目前新建guest使用的預設值

但graylog使用這個type 能開機 但無法執行
目前改成 x86-64-v3 能開機 能執行
試了一下 live migrate 也沒問題

使用 host 是一定有問題的


在支援相同cpu type 的host live migrate是沒問題的


檢查 cpu 支援那些 type

#!/bin/sh -eu

flags=$(cat /proc/cpuinfo | grep flags | head -n 1 | cut -d: -f2)

supports_v2='awk "/cx16/&&/lahf/&&/popcnt/&&/sse4_1/&&/sse4_2/&&/ssse3/ {found=1} END {exit !found}"'
supports_v3='awk "/avx/&&/avx2/&&/bmi1/&&/bmi2/&&/f16c/&&/fma/&&/abm/&&/movbe/&&/xsave/ {found=1} END {exit !found}"'
supports_v4='awk "/avx512f/&&/avx512bw/&&/avx512cd/&&/avx512dq/&&/avx512vl/ {found=1} END {exit !found}"'

echo "$flags" | eval $supports_v2 || exit 2 && echo "CPU supports x86-64-v2"
echo "$flags" | eval $supports_v3 || exit 3 && echo "CPU supports x86-64-v3"
echo "$flags" | eval $supports_v4 || exit 4 && echo "CPU supports x86-64-v4"


2024/05/09

這几天進graylog時提示6版已經出來了
看官網說的是可以直接更新
還是先裝一台來試看看好了
這次用的是almalinux 9
6版已經不再支援 elasticsearch 了
依照官網安裝流程裝到opensearch就有問題了
安裝後無法啟動
看了一下 opensearch.yml

裡面有一段 

######## Start OpenSearch Security Demo Configuration ########
# WARNING: revise all the lines below before you go into production
plugins.security.ssl.transport.pemcert_filepath: esnode.pem
plugins.security.ssl.transport.pemkey_filepath: esnode-key.pem
plugins.security.ssl.transport.pemtrustedcas_filepath: root-ca.pem
plugins.security.ssl.transport.enforce_hostname_verification: false
plugins.security.ssl.http.enabled: true
plugins.security.ssl.http.pemcert_filepath: esnode.pem
plugins.security.ssl.http.pemkey_filepath: esnode-key.pem
plugins.security.ssl.http.pemtrustedcas_filepath: root-ca.pem
plugins.security.allow_unsafe_democertificates: true
plugins.security.allow_default_init_securityindex: true
plugins.security.authcz.admin_dn: ['CN=kirk,OU=client,O=client,L=test,C=de']
plugins.security.audit.type: internal_opensearch
plugins.security.enable_snapshot_restore_privilege: true
plugins.security.check_snapshot_restore_write_privileges: true
plugins.security.restapi.roles_enabled: [all_access, security_rest_api_access]
plugins.security.system_indices.enabled: true
plugins.security.system_indices.indices: [.plugins-ml-agent, .plugins-ml-config, .plugins-ml-connector,
  .plugins-ml-controller, .plugins-ml-model-group, .plugins-ml-model, .plugins-ml-task,
  .plugins-ml-conversation-meta, .plugins-ml-conversation-interactions, .plugins-ml-memory-meta,
  .plugins-ml-memory-message, .plugins-ml-stop-words, .opendistro-alerting-config,
  .opendistro-alerting-alert*, .opendistro-anomaly-results*, .opendistro-anomaly-detector*,
  .opendistro-anomaly-checkpoints, .opendistro-anomaly-detection-state, .opendistro-reports-*,
  .opensearch-notifications-*, .opensearch-notebooks, .opensearch-observability, .ql-datasources,
  .opendistro-asynchronous-search-response*, .replication-metadata-store, .opensearch-knn-models,
  .geospatial-ip2geo-data*, .plugins-flow-framework-config, .plugins-flow-framework-templates,
  .plugins-flow-framework-state]
node.max_local_storage_nodes: 3
######## End OpenSearch Security Demo Configuration ########

感覺是這段的問題

備分後重新開一個新的 opensearch.yml
裡面的內容只要以下這些就好

cluster.name: graylog
node.name: ${HOSTNAME}
path.data: /var/lib/opensearch
path.logs: /var/log/opensearch
discovery.type: single-node
network.host: 0.0.0.0
action.auto_create_index: false
plugins.security.disabled: true
indices.query.bool.max_clause_count: 32768

改完後啟動就沒問題了

跟之前不同 graylog這個版本安裝好後
打開 http://127.0.0.1:9000 無法進到web介面 
看了一下 /var/log/graylog-server/server.log

It seems you are starting Graylog for the first time. To set up a fresh install, a setup interface has
been started. You must log in to it to perform the initial configuration and continue.

Initial configuration is accessible at 0.0.0.0:9000, with username 'admin' and password 'iIcCiFzjWY'.
Try clicking on http://admin:iIcCiFzjWY@0.0.0.0:9000

需要先 Initial configuration 才能使用
進入後依照畫面的步驟設定後 就能進入graylog的介面了

Memory/Heap usage 預設是1G 要再調整

/etc/sysconfig/graylog-server

GRAYLOG_SERVER_JAVA_OPTS="-Xms1g -Xmx1g -server -XX:+UseG1GC -XX:-OmitStackTraceInFastThrow"

依ram大小調整


2023/12/23

今天自己試出來 graylog reopen indices 的語法

curl -v -X POST -H "Content-Type: application/json" -H "X-Requested-By: XMLHttpRequest" -u user:password http://10.0.0.1:9000/api/system/indexer/indices/graylog_245/reopen

別忘了查完要再close起來

2023/11/01

今天因為長官的命令有需求要撈graylog的舊資料

目前是設定60天後的index會自動關起來

在之前的版本如果要查舊資料

要先把index open 後 再 recalculate 才能查

但今天下指令跟在管理介面打開

在管理介面上出現的畫面不同


下指令的不會出現reopened

而且過沒多久就會自動再變成close

從管理介面操作的就會出現綠色的reopened 而且不用再 recalculate 就能直接查資料了

不過如果要打開很多index 就要一個一個點 有點麻煩

不知道有沒有其他指令能做到

2023/10/14

最近nas因為更新發生nfs不能使用的問題

因此暫時把graylog搬到其他台還沒更新的nas上

搬完後發現ES變成red


下指令看一下是那些shards


curl -XGET localhost:9200/_cat/shards|grep UNASSIGNED


index.action       0 r UNASSIGNED

index.do           0 r UNASSIGNED

index.aspx         0 r UNASSIGNED

graylog_159        2 p UNASSIGNED

index.htm          0 r UNASSIGNED

index.py           0 r UNASSIGNED

index.php          0 r UNASSIGNED

index.cgi          0 r UNASSIGNED

index.html         0 r UNASSIGNED

index.cfm          0 r UNASSIGNED

index.pl           0 r UNASSIGNED

index.jsp          0 r UNASSIGNED

index.asp          0 r UNASSIGNED


graylog_159 這個是放資料的 直接砍了 就損失一天的log

curl -XDELETE 'localhost:9200/graylog_159/'

此時ES已經變 yellow

但其他的shards也不知道砍了會不會有問題
forum上說的是因為沒有第二台可以replication所以會出現 UNASSIGNED
如果覺得礙眼不想看到 可以取消 replication
指令如下

curl -X PUT "http://localhost:9200/index_name/_settings" -H 'Content-Type: application/json' -d '{"index":{"number_of_replicas":0}}'

目前就先醬放著吧
再觀察看看


2023/05/05

一直以來都會定時去 graylog 撈 資料

會使用到多個 OR 的下法

accept AND ( 192.168.33.238 OR 192.168.34.215 OR 192.168.33.43 OR 192.168.34.142 OR 192.168.54.247 OR 192.168.7.253 OR 192.168.26.237 OR 192.168.26.228 OR 192.168.25.211 OR 192.168.25.206 OR 192.168.25.117 OR 192.168.26.104 OR 192.168.25.183 OR 192.168.31.241 OR 192.168.30.112 OR 192.168.30.80 OR 192.168.29.6 OR 192.168.29.3 OR 192.168.30.60 OR 192.168.30.58 OR 192.168.29.143 OR 192.168.30.57 OR 192.168.29.223 OR 192.168.29.164 OR 192.168.29.84 OR 192.168.30.200 OR 192.168.30.32 OR 192.168.29.29 OR 192.168.29.199 OR 192.168.29.205 OR 192.168.29.210 OR 192.168.29.200 OR 192.168.29.234 OR 192.168.30.220 OR 192.168.30.194 OR 192.168.29.83 OR 192.168.29.4 OR 192.168.30.108 OR 192.168.29.177 OR 192.168.29.107 OR 192.168.29.32 OR 192.168.30.33 OR 192.168.30.173 OR 192.168.30.247 OR 192.168.30.122 OR 192.168.30.55 OR 192.168.29.19 OR 192.168.29.10 OR 192.168.30.123 OR 192.168.30.201 OR 192.168.29.253 OR 192.168.30.85 OR 192.168.29.48 OR 192.168.30.37 OR 192.168.30.66 OR 192.168.9.100 OR 192.168.30.163 OR 192.168.30.114 OR 192.168.30.59 OR 192.168.30.199 OR 192.168.30.227 OR 192.168.30.41 OR 192.168.29.246 OR 192.168.29.161 OR 192.168.74.248 OR 192.168.74.12 OR 192.168.10.111 OR 192.168.10.104 OR 192.168.50.154 OR 192.168.52.1 OR 192.168.52.3 OR 192.168.50.243 OR 192.168.50.220 OR 192.168.50.179 OR 192.168.50.99 OR 192.168.50.138 OR 192.168.50.98 OR 192.168.50.182 OR 192.168.50.206 OR 192.168.50.234 )


但今天使用同樣的語法

出現以下的 error


While retrieving data for this widget, the following error(s) occurred:

OpenSearch exception [type=too_many_nested_clauses, reason=Query contains too many nested clauses; maxClauseCount is set to 1024].


問了bing


要修改 /etc/opensearch/opensearch.yml

加上 

indices.query.bool.max_clause_count: 10240

重啟 opensearch 目前正常

2023/04/20

graylog時不時就會出現以下的訊息


修改一下 config

預設值是1秒

#gc_warning_threshold = 1s

先改成5秒再觀察看看

新机器進來

把graylog升到5版順便搬進去

原本机器上的設定要移過去

之前都是一個一個做

今天才發現有 content pack 這個功能 超方便的 可以一次搬好

首先進入舊几上的 content pack


建一個新的 content pack


填寫必要欄位 名稱不能使用純數字 否則會有問題


往下拉選擇那些要匯出


選完後下一步下一步就會建立一個新的 content pack  叫 test


在 more actions 可以 download


接下來在新机上一樣進到 content pack 就可以upload


上傳後直接install 就可以了


2023/02/11

今天下午几房斷電
有一台graylog啟動後
三個 service都有起來
但從管理介面看log全都卡住
過了一個小時還是沒有消化
想說應該是 elasticsearch 有問題了
看了log

[2023-02-11T20:27:56,520][WARN ][o.e.c.r.a.AllocationService] [localhost.localdomain] failing shard [failed shard, shard [graylog_666][2], node[0l7asmrIRFeIxc3FyAB14Q], [P], recovery_source[existing store recovery; bootstrap_history_uuid=false], s[INITIALIZING], a[id=yqeR9a7CSUC4ZIIz-a07Gw], unassigned_info[[reason=ALLOCATION_FAILED], at[2023-02-11T12:27:55.997Z], failed_attempts[4], failed_nodes[[0l7asmrIRFeIxc3FyAB14Q]], delayed=false, details[failed shard on node [0l7asmrIRFeIxc3FyAB14Q]: failed recovery, failure RecoveryFailedException[[graylog_666][2]: Recovery failed on {localhost.localdomain}{0l7asmrIRFeIxc3FyAB14Q}{AHesmcGhQvGWAw7Gxl2V6A}{10.10.0.1}{10.10.01:9300}{dimr}]; nested: IndexShardRecoveryException[failed to recover from gateway]; nested: EngineCreationFailureException[failed to create engine]; nested: NoSuchFileException[/mnt/elasticsearch/nodes/0/indices/soJ39cmwT5-UlEyVIPvfAg/2/index/_x63f.fdt]; ], allocation_status[deciders_throttled]], message [failed recovery], failure [RecoveryFailedException[[graylog_666][2]: Recovery failed on {localhost.localdomain}{0l7asmrIRFeIxc3FyAB14Q}{AHesmcGhQvGWAw7Gxl2V6A}{10.10.0.1}{10.10.0.1:9300}{dimr}]; nested: IndexShardRecoveryException[failed to recover from gateway]; nested: EngineCreationFailureException[failed to create engine]; nested: NoSuchFileException[/mnt/elasticsearch/nodes/0/indices/soJ39cmwT5-UlEyVIPvfAg/2/index/_x63f.fdt]; ], markAsStale [true]]
org.elasticsearch.indices.recovery.RecoveryFailedException: [graylog_666][2]: Recovery failed on {localhost.localdomain}{0l7asmrIRFeIxc3FyAB14Q}{AHesmcGhQvGWAw7Gxl2V6A}{10.10.0.1}{10.10.0.1:9300}{dimr}

果然

手動 rotate active write index

有消化了
再觀察看看

2020/11/06

最近有人問到 elasticsearch 備分還原的問題

做個記錄

由於 elasticsearch 安裝完成後預設只能本几連線

所以
/etc/elasticsearch/elasticsearch.yml
最後加上
network.host: 0.0.0.0
允許本几以外的連線
請注意安全問題
加完後elasticsearch要重啟才會生效


接下來在目的机上停止 graylog

systemctl stop graylog-server


查看目的几及來源几上的 indeces

curl -XGET 'http://localhost:9200/_cat/indices'


依需求在目的几上建立indeces 
名稱必須跟來源的 indices 一樣

curl -X PUT "localhost:9200/graylog_514?pretty"


加完後就可以使用 esm 直接複制 indices  順序從小到大

./esm -s http://10.0.0.247:9200 -d http://10.0.0.234:9200 -x graylog_514 -y graylog_514


如果想要備份後再還原 則使用以下指令

備份
./esm -s http://10.0.0.247:9200 -x graylog_455 -o dump.json


還原
./esm -i dump.json -d http://10.0.0.234:9200 -y graylog_455


處理完成後 start graylog

systemctl start graylog-server

要 recalculate index ranges

Indices & Index Sets - Default index set - recalculate index ranges


以上的做法不會更動原資料的時間序


https://github.com/medcl/esm

https://elasticsearch.cn/article/13773

https://community.graylog.org/t/after-data-recovery-not-seeing-data-in-search/13423

2020/01/08

snort suricata
gryalog 的 extractor

suricata

%{WORD:source} %{WORD:UNWANTED}\[%{DATA:UNWANTED}\]: \[%{DATA:suricata_sig_id}\] %{DATA:suricata_msg} \[Classification\: %{DATA:suricata_classification}\] \[Priority\: %{DATA:suricata_priority}\] \{%{DATA:protocol}\} %{IPV4:src_ip}\:%{DATA:srcport} \-\> %{IPV4:dst_ip}\:%{DATA:dstport}$


snort

\[%{DATA:snort_sig_id}\] %{DATA:snort_msg} \[Classification\: %{DATA:snort_classification}\] \[Priority\: %{DATA:snort_priority}\] \{%{DATA:protocol}\} %{IPV4:src_ip}\:%{DATA:srcport} \-\> %{IPV4:dst_ip}\:%{DATA:dstport}$

2019/10/25

graylog上的三個node 總有一個會時出現時不出現
查了一下log
發現一直出現以下的訊息

Did not find meta info of this node. Re-registering.

搜尋了一下
几乎講的都是因為server沒有對時的關係
所以如果有建cluster環境的
切記要注意對時

但是在vmware的環境中
設完chrony對時
還是一直會出現秒差
只能去修改參數

stable_master_timeout = 60000

預設值為2000 就是 2秒
目前先改為60秒 再觀察看看
重啟graylog

後來想起來 vmware一直有時間不準的問題
想不到到現在還沒改善

2019/10/22

今天整理graylog的時候發現一件事

目前我在index set的設定是留180天
超過的delete
不過我會手動去close index
只留約一個月的資料 查詢效率比較好
可是今天發現index超過了180天但系統並沒有去delete
我不確定是不是因為我手動去close的關係
如果真的是如此的話 那政策就要改成定時close
然後再手動去delete了
手動砍的shell如下
每天找出最舊的index再砍掉

#!/bin/bash

del_idx=`/usr/bin/curl -u admin:password 'http://127.0.0.1:9200/_cat/indices/graylog*?v'|grep close|awk '{print $2}'|sort -rn -t_ -k 2|tail -n 1`

/usr/bin/curl -XDELETE "http://localhost:9200/$del_idx/"

用crontab 來做吧

2019/09/18

今天接到另一個問題
有人把graylog的index在沒有close情況下砍光了
然後出現了
graylog_deflector
這個index
砍了又會自動生出來
然後資料也進不去
本來想說再建一個indexset然後改成default再把原來的砍了
但 不行
找了半天
處理方法如下

Stop all Graylog nodes

(OPTIONAL) If you want to keep the already ingested messages, reindex them into the Elasticsearch index with the greatest number, e. g. graylog_23 if you want to fix the deflector graylog_deflector, via the Elasticsearch Reindex API.

Delete the graylog_deflector index via the Elasticsearch Delete Index API.


curl -u user:passwd -XDELETE http://10.0.0.0:9200/graylog_1


Add action.auto_create_index: false to the configuration files of all Elasticsearch nodes in your cluster and restart these Elasticsearch nodes, see Elasticsearch Index API - Automatic Index Creation and Creating an Index for details.

Start the Graylog master node.

Manually rotate the active write index of the index set on the System / Indices / Index Set page in the Maintenance dropdown menu.

(OPTIONAL) Start all remaining Graylog slave nodes.

https://community.graylog.org/t/graylog-error/10800

http://docs.graylog.org/en/3.0/pages/faq.html#how-do-i-fix-the-deflector-exists-as-an-index-and-is-not-an-alias-error-message

目前正常
觀察中

2019/09/07

昨天早上接到有人問graylog的問題 版本 3.0.2
說本來可以正常運作
但改完ip後
就收不到資料了
連進去看之後先df看了一下 發現HD的使用率很高
然後ES的log出現以下的訊息

[INFO ][cluster.routing.allocation.decider] [Milan] low disk watermark [15%] exceeded on [DZqnmWIZRpapZY_TPkkMBw][Milan] free: 58.6gb[12.6%], replicas will not be assigned to this node

徴求user同意後先把一個indices砍了

curl -u admin:password -XDELETE http://10.1.2.3:9200/graylog_0

HD使用率就下降了一半

再來在管理介面上 rotate active write index
 rotate active write index
可是下完後在管理介面上index就跑不出來了
去看了graylog的log出現以下訊息

elasticsearch.exceptions.AuthorizationException: AuthorizationException(403, 'cluster_block_exception', 'blocked by: [FORBIDDEN/12/index read-only / allow delete (api)];')

只好再下指令 unlock

curl -XPUT -H "Content-Type: application/json" http://localhost:9200/_all/_settings -d '{"index.blocks.read_only_allow_delete": null}'

再關掉index

curl -u admin:password -XPOST 'http://10.1.2.3:9200/graylog_4/_close'

在管理介面上就可以看到index了
可是這個時候在search的介面出問題而不能search 
因為下完之前的指令出現了二個open的index

以下是列出所有index的指令
curl -u admin:password 'http://10.1.2.3:9200/_cat/indices/graylog*?v'

所以關掉一個後就正常了

curl -u admin:password -XPOST 'http://10.1.2.3:9200/graylog_5/_close'

到此在log裡就沒有看到任何error

可是訊息還是沒看到而且process buffer一直在100%
用top去看 java也吃掉了大量的cpu
我在猜是不是extractor的問題
因為還要去處理別的問題
所以就先斷線了

後記

之後user有再連絡說log已經有進來了
可能是之前塞住的message消化完了
所以就再觀察看看