2022/09/30

最近登入librenms時出現以下提示


目前使用的這個版本是從官網下載ubunbu 20.04 ova

試著升級但升完後有很多問題

於是打算重裝

選定debian 11 

依照官網的流程一步步順利裝完

再來依照官方FAQ的方式移轉

也順利完成

最後有問題的是weathermap

如果直接copy ubuntu 20.04的目錄過來會發生無法執行的情況

不過官方已有針對php 8.1 進行修改

所以直接 git clone

git clone https://github.com/librenms-plugins/Weathermap.git

再mv目錄 

mv Weathermap /opt/librenms/html/plugins/

把原几的 conf 複制到以下目錄

/opt/librenms/html/plugins/Weathermap/configs


以上就大致完成了

目前觀察中 看看還有沒有其他問題


https://github.com/librenms/packer-builds/releases/tag/21.2.0


https://www.librenms.org/#downloads


https://docs.librenms.org/Installation/Install-LibreNMS/#prepare-linux-server


https://docs.librenms.org/Support/FAQ/#how-do-i-migrate-my-librenms-install-to-another-server

2022/09/10

今天想使用 line 發群組通知

首先申請權杖


官方文件範例是使用 curl


$ curl -X POST -H 'Authorization: Bearer <access_token>' -F 'message=foobar' \

https://notify-api.line.me/api/notify


但試了半天發現一個問題 就是 message 無法換行 

找了好久才找到 範例如下


第一個方法


curl -X POST      -H 'Authorization: Bearer (your token)'      --data-binary message="%0A中文%0A123%0Aabc%0A456"      https://notify-api.line.me/api/notify


第二個方法

curl -X POST    -H 'Authorization: Bearer (your token)'   -d $'message=123\nabc'  https://notify-api.line.me/api/notify


使用python範例如下

檔名存為 line_notify.py

檔案內容如下


import requests

import sys


f = open(sys.argv[1])

msg = f.read()

f.close


def lineNotify(token, msg):

    url = "https://notify-api.line.me/api/notify"

    headers = {

        "Authorization": "Bearer " + token

    }

    payload = {'message': msg}

    r = requests.post(url, headers=headers, data=payload)

    return r.status_code


token = "your token"

lineNotify(token, msg)


只要指定檔案發送
檔案內是什麼內容
發送就是什麼內容

用法

python line_notify.py /tmp/txt_to_send


https://xenby.com/b/274-%E6%95%99%E5%AD%B8-%E5%A6%82%E4%BD%95%E4%BD%BF%E7%94%A8-line-notify-%E5%B0%8D%E7%BE%A4%E7%B5%84%E9%80%B2%E8%A1%8C%E9%80%9A%E7%9F%A5


https://officeguide.cc/python-line-notify-send-messages-images-tutorial-examples/


https://fm-aid.com/bbs2/viewtopic.php?pid=52815


https://notify-bot.line.me/zh_TW/


https://notify-bot.line.me/doc/en/

2022/08/17

centos 7 升級至 almalinux 8 流程


yum install -y http://repo.almalinux.org/elevate/elevate-release-latest-el7.noarch.rpm

yum install -y leapp-upgrade leapp-data-almalinux

leapp preupgrade

rmmod pata_acpi
rmmod floppy
echo PermitRootLogin yes | sudo tee -a /etc/ssh/sshd_config
leapp answer --section remove_pam_pkcs11_module_check.confirm=True

#check any package need to remove if still error


leapp preupgrade


leapp upgrade

2022/07/29

說明一下如何在almalinux 8 上備分資料到 proxmox backup server(pbs)

先在 pbs 上 建立一個 datastore test

到以下網站下載rpm進行安裝

https://github.com/sg4r/proxmox-backup-client

先安裝相依套件

dnf install fuse3

接下來

rpm -Uhv proxmox-backup-2.2.2-1.x86_64.rpm 


安裝完成後執行以下指令

proxmox-backup-client login --repository root@pam@10.0.0.1:8007:test

匯入 fingerprints


如果要備份 /root

建立以下shell 

#!/bin/bash

export PBS_PASSWORD="password"

proxmox-backup-client backup aaa.pxar:/root --repository root@pam@10.0.0.1:8007:test


列出備份資料

proxmox-backup-client snapshot list --repository root@pam@10.0.0.1:8007:test


復原備分資料

proxmox-backup-client restore  --repository root@pam@10.0.0.1:8007:test host/test-pbs-almalinux8/2022-07-29T06:23:05Z aaa.pxar /tmp/test


https://www.coderstudy.co/zh-Hant/article/19cs1_1anq7.html

pvesh

跨 proxmox node 下指令的好用工具

如果要把其他節點的guest開几 指令如下

pvesh create /nodes/<nodeid>/qemu/<vmid>/status/start


https://pve.proxmox.com/pve-docs/pvesh.1.html

http://blog.jason.tools/2019/02/pve-cli-api.html


2022/07/28

今天早ntop 更新出現以下問題 應該是key 過期了

Failed to fetch https://packages.ntop.org/apt-stable/20.04/x64/InRelease  The following signatures couldn't be verified because the public key is not available: NO_PUBKEY 3D84C955924F7599


參考
https://packages.ntop.org/apt-stable/


重新下載再安裝一次
wget https://packages.ntop.org/apt-stable/20.04/all/apt-ntop-stable.deb 

apt install ./apt-ntop-stable.deb

目前正常
再觀察看看

2022/07/27

在raspberry pi 4 上安裝 ubuntu mate 後

聲音預設是從耳几孔輸出

可以安裝一個方便的程式來進行調整由hdmi輸出


sudo apt-add-repository ppa:yktooo/ppa -y 

sudo apt-get update 

sudo apt-get install indicator-sound-switcher -y


https://github.com/yktoo/indicator-sound-switcher

https://www.youtube.com/watch?v=XFNeLzfGB-o

2022/07/13

今天安裝完zeek 一直無法啟動
使用zeekctl
start 後還是不行
接下來使用diag 去看 出現錯誤訊息
查了一下 有人說要先deploy
在 zeekctl 裡下完deploy後就正常了

原來官方說明就有寫了 XD

今天有三台 windows server  在更新完成重開時就一直卡在更新中請勿關閉電腦的畫面
強制重開机也沒用
有朋友說重開在安全模式看看
果然開几按F8重開在安全模式後
顯示更新未成功 進行復原
復原完成再重開回正常模式
之後再手動做一次 windows update
就正常了
同樣的情況發生二次了
目前也找不到原因

2022/07/06

今天在 synology 上使用 docker 設定 vnc repeater

下載

https://hub.docker.com/r/grigiu/vncrepeater

佈置時設好對應 port 即可

預設使用 5500 跟 5901

修改原本使用的SC裡的helpdesk.txt
    加上


    [HOST]
    any
    -id 1234 -connect 10.0.0.1:5500  
   
    10.0.0.1為synology 的 ip


client 使用 vnc viewer 連線的設定如下

10.0.0.1 是 synology ip 視情況更改


2022/07/04

將 guest 移至esxi後 因為需要定時重開几還原

記錄一下設定

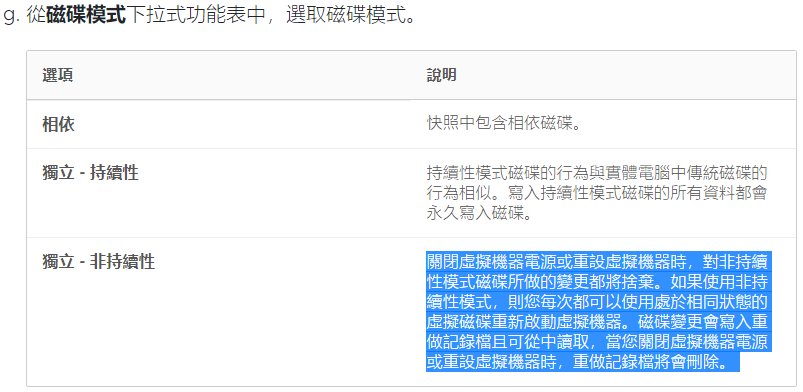
首先將 hd 模式設為 獨立-非持續性


說明如下


esxi啟動 SSH     以SSH登入


接下來取得vmid

vim-cmd vmsvc/getallvms


如果要從esxi關机 指令如下(guest要安裝 vmware tools 指令 apt install open-vm-tools )

vim-cmd vmsvc/power.shutdown [VMID]


開几指令如下

vim-cmd vmsvc/power.on [VMID]

無法直接使用contab -e
必需手動編輯下列檔案

/var/spool/cron/crontabs/root


https://anby.org/index.php/archives/182/


https://www.osslab.com.tw/vmware_disk_mode_recovery/

記一下如何把proxmox 的guest 轉到 esxi

先在proxmox 上把guest 的hd轉成 vmdk格式

qemu-img convert -f raw /dev/pve/vm-118-disk-0 -O vmdk /tmp/new.vmdk


開啟 esxi上的 ssh 把 new.vmdk 傳上去

使用vmkfstools 把 上傳的vmdk轉檔 (-d thin 這個參數一定要下)

vmkfstools -i new.vmdk new-test.vmdk -d thin

在esxi上建立新的guest

在新guest裡把轉好檔的vmdk匯入 並移除原來新建立產生的vmdk

guest開几 重新設定網路及其他相關


https://edywerder.ch/proxmox-to-vmware/


https://www.reddit.com/r/Proxmox/comments/nbfjop/export_proxmox_vm_for_use_with_esxi/

2022/07/03

使用 x11vnc 在 linux 桌面上安裝 vnc server

安裝
sudo apt-get install x11vnc

建立密碼:

x11vnc -storepasswd

start x11vnc Server:

x11vnc -forever -usepw


2022/06/30

今天為了裝一台只有 8G hdd 的机器

找了好久的os

發現現在能裝的os 好少

最後找到 q4os


安裝直接選 自動 裝到好

再來就是處理中文的問題

使用以下指令 把繁中裝上去

$ addlanguage

接下來是輸入法

使用fcitx

apt install fcitx fcitx-table-scj6 fcitx-chewing

之後在config把輸入法選進去

裝好 firefox chrome 目前使用不到 7G


碰到一個問題

如果先啟動 mplayer -ontop 再啟動 chrome 全螢幕  mplayer 會被蓋掉 所以啟動順序只能交換

另外下方的工作列要設為自動隱藏 

如果要開几啟動 要把 shell 放在 /home/adminq/.trinity/Autostart/ 這個目錄下

在shell裡的每行指令最後要加上 &

才能依順執行所有指令

範例

#!/bin/bash

google-chrome --kiosk &

mplayer 1.mp4 &


https://q4os.org/index.html


https://www.q4os.org/dqa007.html#inter

2022/06/29

maltrail 使用公開的ip 及 url黑名單

分為 sensor 及 server 二部分

如果需要有圖形介面才需要安裝 server

單獨安裝sensor即可進偵測並產生log

log目錄預設為 /var/log/maltrail


安裝指令如下

sudo apt-get install git python3-pcapy
git clone github.com/stamparm/maltrail.git
cd maltrail
sudo python sensor.py


裝完後用nmap掃一下得到的結果


"2022-06-28 13:32:14.815681" test-maltrail 10.0.0.1 50137 10.0.0.2 1,3,4,6,7,9,13,17,19,20,21,22,23,24,25,26,30,32,33,37,42,43,49,53,70,79,80,81,82,83,84,85,88,89,90,99,100,106,109,110,111,113,119,125,143,144,146,161,163,179,199,211,212,222,254,255,256,259,264,280,301,306,311,340,366,389,406,407,416,417,425,427,443,444,458,464,465,481,497,500,512,513,514,515,524,541,543,544,545,548,554,555,563,587,593,616,617,625,631,636,646,648,666,667,668,683,687,691,700,705,711,714,720,722,726,749,765,777,783,787,800,801,808,843,873,880,888,898,900,901,902,903,911,912,981,987,990,992,993,995,999,1000,1001,1002,1007,1009,1010,1011,1021,1022,1023,1024,1025,1026,1027,1028,1029,1030,1031,1032,1033,1034,1035,1036,1037,1038,1039,1040,1041,1042,1043,1044,1045,1046,1047,1048,1049,1050,1051,1052,1053,1054,1055,1056,1057,1058,1059,1060,1061,1062,1063,1064,1065,1066,1067,1068,1069,1070,1071,1072,1073,1074,1075,1076,1077,1078,1079,1080,1081,1082,1083,1084,1085,1086,1087,1088,1089,1090,1091,1092,1093,1094,1095,1096,1097,1098,1099,1100,1102,1104,1105,1106,1107,1108,1110,1111,1112,1113,1114,1117,1119,1121,1122,1123,1124,1126,1130,1131,1132,1137,1138,1141,1145,1147,1148,1149,1151,1152,1154,1163,1164,1165,1166,1169,1174,1175,1183,1185,1186,1187,1192,1198,1199,1201,1213,1216,1217,1218,1233,1234,1236,1244,1247,1248,1259,1271,1272,1277,1287,1296,1300,1301,1309,1310,1311,1322,1328,1334,1352,1417,1433,1434,1443,1455,1461,1494,1500,1501,1503,1521,1524,1533,1556,1580,1583,1594,1600,1641,1658,1666,1687,1688,1700,1717,1718,1719,1720,1721,1723,1755,1761,1782,1783,1801,1805,1812,1839,1840,1862,1863,1864,1875,1900,1914,1935,1947,1971,1972,1974,1984,1998,1999,2000,2001,2002,2003,2004,2005,2006,2007,2008,2009,2010,2013,2020,2021,2022,2030,2033,2034,2035,2038,2040,2041,2042,2043,2045,2046,2047,2048,2049,2065,2068,2099,2100,2103,2105,2106,2107,2111,2119,2121,2126,2135,2144,2160,2161,2170,2179,2190,2191,2196,2200,2222,2251,2260,2288,2301,2323,2366,2381,2382,2383,2393,2394,2399,2401,2492,2500,2522,2525,2557,2601,2602,2604,2605,2607,2608,2638,2701,2702,2710,2717,2718,2725,2800,2809,2811,2869,2875,2909,2910,2920,2967,2968,2998,3000,3001,3003,3005,3006,3007,3011,3013,3017,3030,3031,3052,3071,3077,3128,3168,3211,3221,3260,3261,3268,3269,3283,3300,3301,3306,3322,3323,3324,3325,3333,3351,3367,3369,3370,3371,3372,3389,3390,3404,3476,3493,3517,3527,3546,3551,3580,3659,3689,3690,3703,3737,3766,3784,3800,3801,3809,3814,3826,3827,3828,3851,3869,3871,3878,3880,3889,3905,3914,3918,3920,3945,3971,3986,3995,3998,4000,4001,4002,4003,4004,4005,4006,4045,4111,4125,4126,4129,4224,4242,4279,4321,4343,4443,4444,4445,4446,4449,4550,4567,4662,4848,4899,4900,4998,5000,5001,5002,5003,5004,5009,5030,5033,5050,5051,5054,5060,5061,5080,5087,5100,5101,5102,5120,5190,5200,5214,5221,5222,5225,5226,5269,5280,5298,5357,5405,5414,5431,5432,5440,5500,5510,5544,5550,5555,5560,5566,5631,5633,5666,5678,5679,5718,5730,5800,5801,5802,5810,5811,5815,5822,5825,5850,5859,5862,5877,5900,5901,5902,5903,5904,5906,5907,5910,5911,5915,5922,5925,5950,5952,5959,5960,5961,5962,5963,5987,5988,5989,5998,5999,6000,6001,6002,6003,6004,6005,6006,6007,6009,6025,6059,6100,6101,6106,6112,6123,6129,6156,6346,6389,6502,6510,6543,6547,6565,6566,6567,6580,6646,6666,6667,6668,6669,6689,6692,6699,6779,6788,6789,6792,6839,6881,6901,6969,7000,7001,7002,7004,7007,7019,7025,7070,7100,7103,7106,7200,7201,7402,7435,7443,7496,7512,7625,7627,7676,7741,7777,7778,7800,7911,7920,7921,7937,7938,7999,8000,8001,8002,8007,8008,8009,8010,8011,8021,8022,8031,8042,8045,8080,8081,8082,8083,8084,8085,8086,8087,8088,8089,8090,8093,8099,8100,8180,8181,8192,8193,8194,8200,8222,8254,8290,8291,8292,8300,8333,8383,8400,8402,8443,8500,8600,8649,8651,8652,8654,8701,8800,8873,8888,8899,8994,9000,9001,9002,9003,9009,9010,9011,9040,9050,9071,9080,9081,9090,9091,9099,9100,9101,9102,9103,9110,9111,9200,9207,9220,9290,9415,9418,9485,9500,9502,9503,9535,9575,9593,9594,9595,9618,9666,9876,9877,9878,9898,9900,9917,9929,9943,9944,9968,9998,9999,10000,10001,10002,10003,10004,10009,10010,10012,10024,10025,10082,10180,10215,10243,10566,10616,10617,10621,10626,10628,10629,10778,11110,11111,11967,12000,12174,12265,12345,13456,13722,13782,13783,14000,14238,14441,14442,15000,15002,15003,15004,15660,15742,16000,16001,16012,16016,16018,16080,16113,16992,16993,17877,17988,18040,18101,18988,19101,19283,19315,19350,19780,19801,19842,20000,20005,20031,20221,20222,20828,21571,22939,23502,24444,24800,25734,25735,26214,27000,27352,27353,27355,27356,27715,28201,30000,30718,30951,31038,31337,32768,32769,32770,32771,32772,32773,32774,32775,32776,32777,32778,32779,32780,32781,32782,32783,32784,32785,33354,33899,34571,34572,34573,35500,38292,40193,40911,41511,42510,44176,44442,44443,44501,45100,48080,49152,49153,49154,49155,49156,49157,49158,49159,49160,49161,49163,49165,49167,49175,49176,49400,49999,50000,50001,50002,50003,50006,50300,50389,50500,50636,50800,51103,51493,52673,52822,52848,52869,54045,54328,55055,55056,55555,55600,56737,56738,57294,57797,58080,60020,60443,61532,61900,62078,63331,64623,64680,65000,65129,65389 TCP IP 10.0.0.1 "potential port scanning" (heuristic)


2022/06/28

先簡單記一下zeek file extraction


zkg install zeek/hosom/file-extraction


# you must separately load the package for it to actually do anything

zkg load zeek/hosom/file-extraction


mkdir /opt/extract_files


vi /opt/zeek/share/zeek/base/files/extract/main.zeek


#const prefix = "./extract_files/" &redef;

        const prefix = "/opt/extract_files/" &redef;


vi /opt/zeek/share/zeek/site/local.zeek


加上


@load /opt/zeek/share/zeek/policy/frameworks/files/extract-all-files.zeek


root@zeek:~# /opt/zeek/bin/zeekctl


Warning: zeekctl node config has changed (run the zeekctl “deploy” command)


Welcome to ZeekControl 2.2.0


Type “help” for help.


[ZeekControl] > start


starting zeek …


creating crash report for previously crashed nodes: zeek


[ZeekControl] > deploy


[ZeekControl] >quit


https://chanfs.medium.com/file-extraction-with-zeek-2c1a0bb1aa98


https://github.com/hosom/file-extraction


https://www.ericooi.com/zeekurity-zen-part-vi-zeek-file-analysis-framework/

2022/06/27

找到另一個解決方案 mplyaer
直接上語法


mplayer -x 700 -y 500 -noborder -geometry 100:100 -ontop -loop 0 -playlist c:\tmp\2\1.list

無法直接使用目錄播放 必須使用 playlist file

1.list 內容

1.mp4
2.mp4
3.mp4


全螢幕播放

mplayer -fs 2.m4v 


2022/06/25

vlc 使用指令播放 指定視窗大小 播放時桌面位置 只顯示影片 不顯示抬頭及控制列 播放前數秒不顯示檔名 播放時視窗保持在最上層  循環播放資料夾內所有檔案 

vlc -I dummy --width=500 --height=400 --video-x=100 --video-y=100 --no-video-deco --loop --no-video-title --video-on-top --no-autoscale c:\tmp\2

 以上只能運行於 windows 而且 --width=500 --height=400 這二個參數有時無法作用


2022/06/22

/dev/urandom 取得隨几數


随机转换为md5(20位):

head /dev/urandom | md5sum | head -c 20

随机纯数字(20位):

head /dev/urandom | tr -dc 0-9 | head -c 20

随机小写字母+数字(20位):

head /dev/urandom | tr -dc a-z0-9 | head -c 20

随机大小写字母+数字(20位):

head /dev/urandom | tr -dc A-Za-z0-9 | head -c 20

https://piaohua.github.io/post/linux/20200825-linux-dev-urandom/

2022/06/15

之前碰到 almalinux 9 在 lxc 無法開几的問題

有人提供解法了

root@nte-proxmox-1:~# pct enter 106

[root@alma9test ~]# cat /etc/redhat-release

AlmaLinux release 9.0 (Emerald Puma)

[root@alma9test ~]# systemctl stop systemd-firstboot

[root@alma9test ~]# exit 


https://forum.proxmox.com/threads/lxc-almalinux-9-issue.110348/

2022/06/07

wget http://www.caesum.com/handbook/Stegsolve.jar -O stegsolve.jar

java -jar stegsolve.jar


http://www.caesum.com/handbook/Stegsolve.jar

2022/06/05

解密網站


SQL Injection


Username: admin' --

Password: 123

Actual Query: SELECT * FROM users WHERE username='admin' -- AND password='123'


Username: admin' union select * from users where '1

Password: 123

Actual Query: SELECT * FROM users WHERE username='admin' union select * from users where '1' AND password='123'


Username: admin';

Password: 123

Actual Query: SELECT * FROM users WHERE username='admin';' AND password='123'


Username: ad'||'min';

Password: 123

Actual Query: SELECT * FROM users WHERE username='ad'||'min';' AND password='123'


https://github.com/onealmond/hacking-lab/blob/master/picoctf-2020/web-gauntlet/writeup.md

今天拿到一個 img file 要讀取裡面的內容
所以想直接mount來用

使用kpartx

kpartx -av test.img
add map loop21p1 (253:0): 0 260096 linear 7:21 2048

分區的對應會放到到 /dev/mapper/loop21p1

直接mount
mount /dev/mapper/loop21p1 /mnt/test/

zsteg

apt install ruby

gem install zsteg


https://github.com/zed-0xff/zsteg

2022/05/26

因為要用linux shell 產生值再透過snmp server 讓 librenms 撈出後能畫圖

找到 python snmp server

只要一行指令

Standalone usage: snmp-server.py [-h] [-p PORT] [-c CONFIG] [-d] [-v]

SNMP server

optional arguments:
  -h, --help            show this help message and exit
  -p PORT, --port PORT  port (by default 161 - requires root privileges)
  -c CONFIG, --config CONFIG
                        OIDs config file
  -d, --debug           run in debug mode
  -v, --version         show program's version number and exit

要產生snmp值的範例檔如下

DATA = {
  '1.3.6.1.4.1.1.1.0': integer(12345),
  '1.3.6.1.4.1.1.2.0': bit_string('\x12\x34\x56\x78'),
  '1.3.6.1.4.1.1.3.0': octet_string('test'),
  '1.3.6.1.4.1.1.4.0': null(),
  '1.3.6.1.4.1.1.5.0': object_identifier('1.3.6.7.8.9'),
  # notice the wildcards:
  '1.3.6.1.4.1.1.6.*': lambda oid: octet_string('* {}'.format(oid)),
  '1.3.6.1.4.1.1.?.0': lambda oid: octet_string('? {}'.format(oid)),
  '1.3.6.1.4.1.2.1.0': real(1.2345),
  '1.3.6.1.4.1.3.1.0': double(12345.2345),


snmpwalk 指定 ip port

snmpwalk -c public -v 2c 10.1.1.1:1611 .1.2.3


2022/05/21

之前一直都是在synology上使用docker
但因為某個原因
必須在有adsl線路上的几器上能讓外部連入
所以想到在該几器上安裝docker
記錄一下 目前有使用到的指令

安裝
sudo apt install docker.io

檢查狀態
systemctl status docker

設定開几啟動
sudo systemctl enable docker

把要使用docker的user加入docker群組
sudo usermod -aG docker username

登出再登入

檢查docker
docker version

搜尋docker 映像檔 ubuntu
docker search ubuntu

下載映像檔
docker pull ubuntu

列出目前已下載的映像檔
docker images

啟動 container 
docker run -itd container_id /bin/bash

列出目前已啟動的container
docker ps

登入已啟動的container
docker exec -it  container_id /bin/bash

安裝 ssh server
apt install open-sshserver

參考此篇設定使用public key 登入並改變啟動port
假設改為 port 2222

全部改好後存檔成另一個images 
docker commit container_id
會存成另一個images

關閉container
docker stop container_id

重新啟動並對應port 而且啟動ssh server 並設定重開後啟動container
docker run container_id -p 2222:2222 --restart=always /usr/sbin/sshd -D 

docker images
REPOSITORY   TAG       IMAGE ID       CREATED        SIZE
<none>       <none>    57d619e840f1   16 hours ago   274MB
ubuntu       latest    d2e4e1f51132   3 weeks ago    77.8MB

刪除不使用的images
docker rmi image_id


查看目前所有容器的狀態 包含正在執行及已stop 
docker ps -a

停止容器的命令如下
$ docker stop container_id

啟動停止的容器 容器內之前的異動資料不會消失
$ docker start container_id


删除容器
$ docker rm container_id


2022/05/17

如何使用 postman 登入 juice shop 並拿到 bearer token


用 POST 而且在 body 以 json 格式輸入 登入的 email及密碼


auth type 選擇 No Auth


Send 後 畫面下方即可得到 bearer token


2022/05/13

由於 proxmox 几器愈來愈多

所以使用dsh 來處理升級問題

其他几器暫不考慮

因為還要使用key認証 而且os也有不同

流程如下


先建立群組檔

vi ~/.dsh/group/temp

10.0.0.1

10.0.0.2

10.0.0.3


建立好後指令如下

dsh -g temp -M  -r ssh -- df -h

如果要下多個指令 要使用單引號 而且指令用 ; 隔開

dsh -g temp -M  -r ssh -- 'df-h;ls;date'


https://blog.csdn.net/dcj3sjt126com/article/details/84691641

owasp 提供的靶場


https://owasp.org/www-project-juice-shop/


https://owasp.org/www-project-webgoat/


https://github.com/adeyosemanputra/pygoat


https://github.com/OWASP/SecurityShepherd

2022/05/11

http://www.jsfuck.com/


http://www.atoolbox.net/Tool.php?Id=703


https://utf-8.jp/public/jjencode.html


https://github.com/pablojorge/brainfuck

2022/05/09

今天要disable ubuntu 18.04 的ipv6的時候


在 /etc/sysctl.conf 加入以下三行


net.ipv6.conf.all.disable_ipv6=1

net.ipv6.conf.default.disable_ipv6=1

net.ipv6.conf.lo.disable_ipv6 = 1


sysctl -p 是有作用的 可是重開就不行了

有人說是bug

只好換一種方法

修改 /etc/default/grub

GRUB_CMDLINE_LINUX="ipv6.disable=1"

再update grub

sudo update-grub


重開就ok了


https://linuxconfig.org/how-to-disable-ipv6-address-on-ubuntu-18-04-bionic-beaver-linux

2022/04/18

昨天是舊憑証的到期日

所以今天要撈出那些ip已經上了新憑証

把封包導入解密 


使用 nmap 查找憑証指令如下 

再找出使用 TWCA 的憑証 並 列出憑証到期日

#!/bin/bash


for i in {1..250}

do

echo $i

        nmap -Pn --script ssl-cert -p 443 10.0.0.$i -oN ca_$i

done


若把執行結果餵到變數 注意以下不同

r=`nmap --script ssl-cert -p 443 10.0.0.$i|grep -E 'TWCA|after'`

echo $r > ca_$i  #導出結果無換行 

        echo "$r" > ca_$i #導出結果有換行


使用 curl 程式如下 

#!/bin/bash


for i in {1..250}

do

echo $i

curl -m 3 https://10.0.0.$i -k -v -s -o /dev/null 2> /tmp/ca/ca_$i

done


接下來再針對關鍵字及有無過期查找即可

2022/04/11

今天有朋友問greenbone的問題

到官網看了一下

名字又改了

改成  Greenbone Enterprise TRIAL

不過下載時看到的檔案還是GSM

只是比之前用的版本又更新了

順便記錄一下怎麼匯入 proxmox


ova下載回來後先解開

tar xvf GSM-TRIAL-21.04.15-VirtualBox.ova

有一個 ovf 跟一個 vmdk 只需要使用 vmdk

把vmdk 上傳到 proxmox  

在proxmox 上 create 一個vm

cpu給2顆 ram給5G

接下來把建立時預設的那個HD刪除

把剛剛上傳的vmdk匯入

qm importdisk 132 GSM-TRIAL-21.04.15-VirtualBox-disk001.vmdk local-lvm

把匯入的HD掛上    BUS一定要使用 IDE

把BIOS調整成 UEFI

調整開几順序 使用剛剛匯入的HD開几

開几完成使用 admin/admin 在 console登入

接下來建立 web 介面的帳號密碼及更新 feed

完成後即可使用 web 介面登入操作


https://www.greenbone.net/en/testnow/


2022/03/10

今天使用shotcut

一直閃退

不知出了什麼問題


https://shotcut.org/

2022/02/13

換成aruba ap12 碰到一個奇怪的問題

在raspberry 3B上連線都沒問題

可是到了 raspberry 4 上

就變成看得到 SSID 可是無法連線

找了一下froum

也有人碰到相同的問題

怪的是竟然有人說跟螢幕解析度有關

另外是說跟SSID有關 不要用特殊字完或許能解決問題

果然

本來是設定 abc-5G 

改成 abc5g 就可以了

醬問題就更怪了

二個的差別除了硬体版本不同

還有os也不同

raspberry 3B               kali linux

raspberry 4                 ubuntu mate


https://forums.raspberrypi.com/viewtopic.php?t=247982

2022/02/10

在proxmox中開啟 guest的no vnc console 後

使用vi會碰到一個問題

就是按 esc 時會整個跳出來

在home 目錄新增 .vimrc 

並加上

inoremap qq <esc>

就可以把 連按二下 qq 換成 esc 


另外在不改變任何設定的情況下

可以直接使用 Ctrl + c 來取代 esc 


之前從centos 8 升到 centos 8 stream 的几器最近無法更新

出現以下訊息


 [root@localhost ~]# dnf -y update

Failed to set locale, defaulting to C.UTF-8

CentOS Linux 8 - AppStream                      51  B/s |  38  B     00:00    

Error: Failed to download metadata for repo 'appstream': Cannot prepare internal mirrorlist: No URLs in mirrorlist


重新執行以下指令

dnf --disablerepo '*' --enablerepo extras swap centos-linux-repos centos-stream-repos

dnf distro-sync

再 dnf -y update 就正常了


2022/01/18

今天更新完proxmox的kernel後

要修改backup的資料

結果 /etc/pve/vzdump.cron裡只有以下內容


# cluster wide vzdump cron schedule

# Automatically generated file - do not edit


PATH="/usr/sbin:/usr/bin:/sbin:/bin"


備分的config放到 /etc/pve/jobs.cfg 去了

而且內容跟之前完全不同


目前發現有些有轉換有些並沒有

當使用web介面設定備分後 才會轉換到新設定


2022/01/15

proxmox 目前有支援 metric server 把系統資料往外丟到

Graphite 或 InfluxDB


就可以利用grafana來畫圖

因為proxmox丟到influxdb只提供 udp http https 三種方式

而influxdb預設使用tcp

因此要修改 /etc/influxdb/influxdb.conf

加上

[[udp]]
    enabled = true
    bind-address = "0.0.0.0:8089"
    database = "proxmox"
    batch-size = 1000
    batch-timeout = "1s"

proxmox 上的設定如上圖

如果設定新 proxmox 的dashboard
步驟如下
先在influxdb
create 新database
create database proxmox_new

再修改 /etc/influxdb/influxdb.conf    

加上

[[udp]]
    enabled = true
    bind-address = "0.0.0.0:8090"
    database = "proxmox_new"
    batch-size = 1000
    batch-timeout = "1s"

注意藍字部分
改完後重啟 influxdb

接下來到proxmox主控台依上述的config進行設定

再來設定grafana

到 https://grafana.com/grafana/dashboards/10048/revisions 下載 proxmox_rev1.json

修改 proxmox_rev1.json 內容 檔案最下方

"title": "Proxmox_new", "uid": "kxQQuHRak",


改完後 import 時要選擇 upload json file 使用上述修改好的檔案


https://www.cxybb.com/article/caiyqn/106380171


https://www.linuxsysadmins.com/monitoring-proxmox-with-grafana/


2022/01/10

想在其他網頁上show出grafana的圖

查了一些資料

說到可以改為anonymous不登入

但感覺醬不太安全

最後決定使用api key的方式來處理

首先產生api key

登入後 在畫面左邊的齒輪(configuration)點進去 再點選 API keys


因為目前不支援整個dashboard的render 只能單一panel

所以在panel上方點出選項然後再點下 share


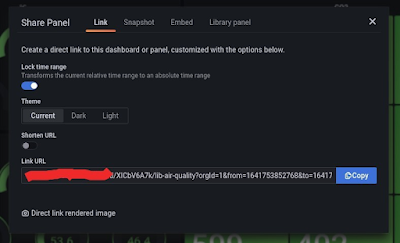
因為沒有安裝 renderer  所以出現以下訊息


以下指令安裝

grafana-cli plugins install grafana-image-renderer


安裝後就會出現

direct link rendered image 的連結


但點下去之後出現


無法畫圖

查了一下log

要在OS補上以下的package

yum install -y atk

yum install -y at-spi2-atk

yum install -y cups-libs

yum install -y libdrm

yum install -y libxkbcommon

yum install -y libXcomposite

yum install -y libXdamage

yum install -y mesa-libgbm

yum install -y pango

yum install -y alsa-lib

補好再點就會出現圖了


些時就可以使用 api key把圖捉出來了

curl 使用的連結就是 direct link rendered image 的連結

以下語法是取出10分鐘前到現在的資料

curl -H "Authorization: Bearer your api key" "http://10.0.0.1:3000/render/d-solo/XICbV6A7k/lib-air-quality?orgId=1&from=now-10m&to=now&panelId=6&width=1000&height=500&tz=Asia%2FTaipei"  > output.png


https://grafana.com/docs/grafana/latest/image-rendering/

https://mattionline.de/grafana-api-export-graph-as-png/

2022/01/01

本次弱掃出現很多台几器有相同的問題


Vulnerability Detection Result

'Vulnerable' cipher suites accepted by this service via the TLSv1.0 protocol:

TLS_DHE_RSA_WITH_3DES_EDE_CBC_SHA (SWEET32)

TLS_ECDHE_RSA_WITH_3DES_EDE_CBC_SHA (SWEET32)

TLS_RSA_WITH_3DES_EDE_CBC_SHA (SWEET32)

'Vulnerable' cipher suites accepted by this service via the TLSv1.1 protocol:

TLS_DHE_RSA_WITH_3DES_EDE_CBC_SHA (SWEET32)

TLS_ECDHE_RSA_WITH_3DES_EDE_CBC_SHA (SWEET32)

TLS_RSA_WITH_3DES_EDE_CBC_SHA (SWEET32)

'Vulnerable' cipher suites accepted by this service via the TLSv1.2 protocol:

TLS_DHE_RSA_WITH_3DES_EDE_CBC_SHA (SWEET32)

TLS_ECDHE_RSA_WITH_3DES_EDE_CBC_SHA (SWEET32)

TLS_RSA_WITH_3DES_EDE_CBC_SHA (SWEET32)


處理方法如下

vi /etc/httpd/conf.d

修改如下


#SSLProtocol all -SSLv2 -SSLv3

SSLProtocol all -SSLv2 -SSLv3 -TLSv1 -TLSv1.1


#   SSL Cipher Suite:

#   List the ciphers that the client is permitted to negotiate.

#   See the mod_ssl documentation for a complete list.

#SSLCipherSuite HIGH:3DES:!aNULL:!MD5:!SEED:!IDEA


SSLCipherSuite HIGH:!3DES:!aNULL:!MD5:!SEED:!IDEA


改完後 restart 

systemctl restart httpd


以nmap進行測試


nmap --script ssl-enum-ciphers -p 443 10.0.0.1

Starting Nmap 7.80 ( https://nmap.org ) at 2022-01-01 13:54 CST

Nmap scan report for www.nkuht.edu.tw (10.0.0.1)

Host is up (0.00029s latency).


PORT    STATE SERVICE

443/tcp open  https

| ssl-enum-ciphers:

|   TLSv1.2:

|     ciphers:

|       TLS_ECDHE_RSA_WITH_AES_256_GCM_SHA384 (secp256r1) - A

|       TLS_ECDHE_RSA_WITH_AES_128_GCM_SHA256 (secp256r1) - A

|       TLS_DHE_RSA_WITH_AES_256_GCM_SHA384 (dh 2048) - A

|       TLS_DHE_RSA_WITH_AES_128_GCM_SHA256 (dh 2048) - A

|       TLS_ECDHE_RSA_WITH_AES_256_CBC_SHA384 (secp256r1) - A

|       TLS_ECDHE_RSA_WITH_AES_256_CBC_SHA (secp256r1) - A

|       TLS_DHE_RSA_WITH_AES_256_CBC_SHA256 (dh 2048) - A

|       TLS_DHE_RSA_WITH_AES_256_CBC_SHA (dh 2048) - A

|       TLS_ECDHE_RSA_WITH_AES_128_CBC_SHA256 (secp256r1) - A

|       TLS_ECDHE_RSA_WITH_AES_128_CBC_SHA (secp256r1) - A

|       TLS_DHE_RSA_WITH_AES_128_CBC_SHA256 (dh 2048) - A

|       TLS_DHE_RSA_WITH_AES_128_CBC_SHA (dh 2048) - A

|       TLS_RSA_WITH_AES_256_GCM_SHA384 (rsa 2048) - A

|       TLS_RSA_WITH_AES_128_GCM_SHA256 (rsa 2048) - A

|       TLS_RSA_WITH_AES_256_CBC_SHA256 (rsa 2048) - A

|       TLS_RSA_WITH_AES_256_CBC_SHA (rsa 2048) - A

|       TLS_RSA_WITH_AES_128_CBC_SHA256 (rsa 2048) - A

|       TLS_RSA_WITH_AES_128_CBC_SHA (rsa 2048) - A

|     compressors:

|       NULL

|     cipher preference: server

|_  least strength: A


Nmap done: 1 IP address (1 host up) scanned in 0.58 seconds

2021/11/05

之前複製流量都是從 switch 設定 port mirror 
但因為port數量有限制 
想說從linux上來處理 找到 daemonlogger 還滿方便的 

 daemonlogger -i eth1 -o eth2 -d 

如果是proxmox 在 guest  設定沒用
要在host上設定

2021/11/02

有個guest在備分時偶爾會出現以下的錯誤
怪的狀況不是每天
而是不定時會發生

109: 2021-11-01 23:34:40 INFO: Starting Backup of VM 109 (qemu)
109: 2021-11-01 23:34:40 INFO: status = running
109: 2021-11-01 23:34:40 INFO: VM Name: 0.226-examtest
109: 2021-11-01 23:34:40 INFO: include disk 'virtio0' 'nfs218_system:109/vm-109-disk-0.qcow2' 100G
109: 2021-11-01 23:34:40 INFO: backup mode: snapshot
109: 2021-11-01 23:34:40 INFO: ionice priority: 7
109: 2021-11-01 23:34:40 INFO: creating Proxmox Backup Server archive 'vm/109/2021-11-01T15:34:40Z'
109: 2021-11-01 23:34:41 INFO: started backup task '2ba8928b-bd3b-4e90-a62f-7fd1a37d51d8'
109: 2021-11-01 23:34:41 INFO: resuming VM again
109: 2021-11-01 23:34:44 ERROR: VM 109 qmp command 'cont' failed - got timeout
109: 2021-11-01 23:34:44 INFO: aborting backup job
109: 2021-11-01 23:34:44 INFO: resuming VM again
109: 2021-11-01 23:34:44 ERROR: Backup of VM 109 failed - VM 109 qmp command 'cont' failed - got timeout


查了一下forum有人碰到相同的情況

是建議修改

/usr/share/perl5/PVE/QMPClient.pm 

in line 134

      } else {
            $timeout = 3; # default
to
      } else {
            $timeout = 8; # default

我直接把 $timeout改為30

restarted the pve daemons

for service in pvedaemon.service pveproxy.service pvestatd.service ;do
     echo "systemctl restart $service"
     systemctl restart $service
  done


目前就先醬改了
再觀察看看


2021/10/31

proxmox更新到7版後

在管理介面 mount nfs 可以選 v3 或 v4


用fio測一下 v3 和 v4 的效能差別

config 如下


# This job file tries to mimic the Intel IOMeter File Server Access Pattern

[global]

description=Emulation of Intel IOmeter File Server Access Pattern


[iometer]

bssplit=512/10:1k/5:2k/5:4k/60:8k/2:16k/4:32k/4:64k/10

filename=PhysicalDrive1:PhysicalDrive2:PhysicalDrive3

size=10G

rw=randrw

#set read 50% write 50%

rwmixread=50

direct=1

runtime=60

# IOMeter defines the server loads as the following:

# iodepth=1                    Linear

# iodepth=4                    Very Light

# iodepth=8                    Light

# iodepth=64                    Moderate

# iodepth=256                    Heavy

iodepth=64


測三次 取最後一次的值如下


nfs v4


iometer: (g=0): rw=randrw, bs=(R) 512B-64.0KiB, (W) 512B-64.0KiB, (T) 512B-64.0KiB, ioengine=psync, iodepth=64

fio-3.25

Starting 1 process

Jobs: 1 (f=3): [m(1)][100.0%][r=168KiB/s,w=107KiB/s][r=11,w=12 IOPS][eta 00m:00s]

iometer: (groupid=0, jobs=1): err= 0: pid=2342174: Sun Oct 31 07:28:44 2021

  Description  : [Emulation of Intel IOmeter File Server Access Pattern]

  read: IOPS=55, BW=610KiB/s (625kB/s)(35.7MiB/60016msec)

    clat (usec): min=430, max=339828, avg=10019.94, stdev=13081.64

     lat (usec): min=431, max=339828, avg=10020.43, stdev=13081.64

    clat percentiles (usec):

     |  1.00th=[   775],  5.00th=[  3228], 10.00th=[  4015], 20.00th=[  5473],

     | 30.00th=[  6587], 40.00th=[  7832], 50.00th=[  9110], 60.00th=[ 10159],

     | 70.00th=[ 11338], 80.00th=[ 12387], 90.00th=[ 13304], 95.00th=[ 14222],

     | 99.00th=[ 43254], 99.50th=[ 99091], 99.90th=[208667], 99.95th=[299893],

     | 99.99th=[341836]

   bw (  KiB/s): min=   72, max= 1180, per=100.00%, avg=613.90, stdev=270.71, samples=119

   iops        : min=    8, max=   90, avg=56.03, stdev=18.14, samples=119

  write: IOPS=57, BW=592KiB/s (606kB/s)(34.7MiB/60016msec); 0 zone resets

    clat (usec): min=316, max=218978, avg=7624.96, stdev=11376.82

     lat (usec): min=316, max=218979, avg=7626.12, stdev=11376.98

    clat percentiles (usec):

     |  1.00th=[   400],  5.00th=[   457], 10.00th=[   490], 20.00th=[   586],

     | 30.00th=[  1172], 40.00th=[  4113], 50.00th=[  6128], 60.00th=[  8094],

     | 70.00th=[ 10028], 80.00th=[ 11994], 90.00th=[ 13960], 95.00th=[ 18482],

     | 99.00th=[ 37487], 99.50th=[ 85459], 99.90th=[152044], 99.95th=[212861],

     | 99.99th=[219153]

   bw (  KiB/s): min=   18, max= 1278, per=100.00%, avg=595.21, stdev=271.81, samples=119

   iops        : min=    6, max=  106, avg=58.24, stdev=19.98, samples=119

  lat (usec)   : 500=6.12%, 750=8.19%, 1000=1.17%

  lat (msec)   : 2=1.67%, 4=7.70%, 10=39.02%, 20=33.10%, 50=2.17%

  lat (msec)   : 100=0.41%, 250=0.41%, 500=0.03%

  cpu          : usr=0.16%, sys=0.57%, ctx=6838, majf=0, minf=14

  IO depths    : 1=100.0%, 2=0.0%, 4=0.0%, 8=0.0%, 16=0.0%, 32=0.0%, >=64=0.0%

     submit    : 0=0.0%, 4=100.0%, 8=0.0%, 16=0.0%, 32=0.0%, 64=0.0%, >=64=0.0%

     complete  : 0=0.0%, 4=100.0%, 8=0.0%, 16=0.0%, 32=0.0%, 64=0.0%, >=64=0.0%

     issued rwts: total=3339,3476,0,0 short=0,0,0,0 dropped=0,0,0,0

     latency   : target=0, window=0, percentile=100.00%, depth=64


Run status group 0 (all jobs):

   READ: bw=610KiB/s (625kB/s), 610KiB/s-610KiB/s (625kB/s-625kB/s), io=35.7MiB (37.5MB), run=60016-60016msec

  WRITE: bw=592KiB/s (606kB/s), 592KiB/s-592KiB/s (606kB/s-606kB/s), io=34.7MiB (36.4MB), run=60016-60016msec


nfs v3


iometer: (g=0): rw=randrw, bs=(R) 512B-64.0KiB, (W) 512B-64.0KiB, (T) 512B-64.0KiB, ioengine=psync, iodepth=64

fio-3.25

Starting 1 process

Jobs: 1 (f=3): [m(1)][100.0%][r=581KiB/s,w=609KiB/s][r=51,w=42 IOPS][eta 00m:00s]

iometer: (groupid=0, jobs=1): err= 0: pid=2347167: Sun Oct 31 07:35:09 2021

  Description  : [Emulation of Intel IOmeter File Server Access Pattern]

  read: IOPS=49, BW=548KiB/s (561kB/s)(32.1MiB/60012msec)

    clat (usec): min=394, max=285769, avg=9756.36, stdev=10269.42

     lat (usec): min=394, max=285770, avg=9756.86, stdev=10269.42

    clat percentiles (usec):

     |  1.00th=[   889],  5.00th=[  3294], 10.00th=[  4113], 20.00th=[  5407],

     | 30.00th=[  6718], 40.00th=[  7898], 50.00th=[  8979], 60.00th=[ 10290],

     | 70.00th=[ 11338], 80.00th=[ 12387], 90.00th=[ 13435], 95.00th=[ 14484],

     | 99.00th=[ 30278], 99.50th=[ 56361], 99.90th=[206570], 99.95th=[233833],

     | 99.99th=[287310]

   bw (  KiB/s): min=    8, max= 1118, per=100.00%, avg=548.19, stdev=256.60, samples=119

   iops        : min=    2, max=   86, avg=49.50, stdev=15.73, samples=119

  write: IOPS=51, BW=522KiB/s (534kB/s)(30.6MiB/60012msec); 0 zone resets

    clat (usec): min=357, max=221586, avg=10035.07, stdev=12250.59

     lat (usec): min=358, max=221587, avg=10036.14, stdev=12250.75

    clat percentiles (usec):

     |  1.00th=[   482],  5.00th=[   627], 10.00th=[  1172], 20.00th=[  4146],

     | 30.00th=[  5735], 40.00th=[  7111], 50.00th=[  8586], 60.00th=[ 10159],

     | 70.00th=[ 11600], 80.00th=[ 13042], 90.00th=[ 16188], 95.00th=[ 21103],

     | 99.00th=[ 47449], 99.50th=[ 93848], 99.90th=[168821], 99.95th=[196084],

     | 99.99th=[221250]

   bw (  KiB/s): min=   34, max= 1039, per=100.00%, avg=523.79, stdev=223.74, samples=119

   iops        : min=    6, max=   82, avg=51.63, stdev=15.50, samples=119

  lat (usec)   : 500=0.73%, 750=4.03%, 1000=0.87%

  lat (msec)   : 2=0.71%, 4=7.69%, 10=44.35%, 20=37.52%, 50=3.37%

  lat (msec)   : 100=0.38%, 250=0.33%, 500=0.02%

  cpu          : usr=0.25%, sys=0.59%, ctx=6076, majf=0, minf=15

  IO depths    : 1=100.0%, 2=0.0%, 4=0.0%, 8=0.0%, 16=0.0%, 32=0.0%, >=64=0.0%

     submit    : 0=0.0%, 4=100.0%, 8=0.0%, 16=0.0%, 32=0.0%, 64=0.0%, >=64=0.0%

     complete  : 0=0.0%, 4=100.0%, 8=0.0%, 16=0.0%, 32=0.0%, 64=0.0%, >=64=0.0%

     issued rwts: total=2968,3090,0,0 short=0,0,0,0 dropped=0,0,0,0

     latency   : target=0, window=0, percentile=100.00%, depth=64


Run status group 0 (all jobs):

   READ: bw=548KiB/s (561kB/s), 548KiB/s-548KiB/s (561kB/s-561kB/s), io=32.1MiB (33.7MB), run=60012-60012msec

  WRITE: bw=522KiB/s (534kB/s), 522KiB/s-522KiB/s (534kB/s-534kB/s), io=30.6MiB (32.1MB), run=60012-60012msec


初步看起來 v4 稍微好一些

2021/10/24

在all ssd 的 nas 上用 fio 測了一次io

config 如下

# This job file tries to mimic the Intel IOMeter File Server Access Pattern
[global]
description=Emulation of Intel IOmeter File Server Access Pattern

[iometer]
bssplit=512/10:1k/5:2k/5:4k/60:8k/2:16k/4:32k/4:64k/10
filename=\\.\PhysicalDrive1:\\.\PhysicalDrive2:\\.\PhysicalDrive3
size=1G
rw=randrw
#set read 50% write 50%
rwmixread=50
direct=1
runtime=60                  
# IOMeter defines the server loads as the following:
# iodepth=1                    Linear
# iodepth=4                    Very Light
# iodepth=8                    Light
# iodepth=64                    Moderate
# iodepth=256                    Heavy
iodepth=64


4個模式結果如下

default no cache

iometer: (g=0): rw=randrw, bs=(R) 512B-64.0KiB, (W) 512B-64.0KiB, (T) 512B-64.0KiB, ioengine=psync, iodepth=64
fio-3.7
Starting 1 process
iometer: Laying out IO files (3 files / total 1023MiB)
Jobs: 1 (f=3): [m(1)][100.0%][r=12.1MiB/s,w=12.3MiB/s][r=2912,w=2900 IOPS][eta 00m:00s]
iometer: (groupid=0, jobs=1): err= 0: pid=1059: Sun Oct 24 21:59:29 2021
  Description  : [Emulation of Intel IOmeter File Server Access Pattern]
   read: IOPS=2643, BW=15.0MiB/s (16.7MB/s)(518MiB/32459msec)
    clat (usec): min=98, max=3023, avg=151.62, stdev=52.08
     lat (usec): min=100, max=3025, avg=153.64, stdev=52.78
    clat percentiles (usec):
     |  1.00th=[  108],  5.00th=[  113], 10.00th=[  116], 20.00th=[  120],
     | 30.00th=[  124], 40.00th=[  129], 50.00th=[  137], 60.00th=[  145],
     | 70.00th=[  153], 80.00th=[  167], 90.00th=[  217], 95.00th=[  262],
     | 99.00th=[  326], 99.50th=[  367], 99.90th=[  498], 99.95th=[  644],
     | 99.99th=[ 1074]
   bw (  KiB/s): min=   17, max=29187, per=100.00%, avg=16368.95, stdev=5319.54, samples=64
   iops        : min=    6, max= 3237, avg=2636.11, stdev=553.54, samples=64
  write: IOPS=2632, BW=15.6MiB/s (16.4MB/s)(506MiB/32459msec)
    clat (usec): min=109, max=269781, avg=208.42, stdev=1809.64
     lat (usec): min=111, max=269787, avg=210.60, stdev=1809.68
    clat percentiles (usec):
     |  1.00th=[  117],  5.00th=[  122], 10.00th=[  126], 20.00th=[  131],
     | 30.00th=[  137], 40.00th=[  141], 50.00th=[  151], 60.00th=[  159],
     | 70.00th=[  167], 80.00th=[  182], 90.00th=[  233], 95.00th=[  277],
     | 99.00th=[  343], 99.50th=[  388], 99.90th=[13435], 99.95th=[32637],
     | 99.99th=[77071]
   bw (  KiB/s): min=   25, max=27107, per=100.00%, avg=16004.09, stdev=5117.56, samples=64
   iops        : min=    8, max= 3423, avg=2627.02, stdev=552.46, samples=64
  lat (usec)   : 100=0.01%, 250=93.02%, 500=6.83%, 750=0.06%, 1000=0.02%
  lat (msec)   : 2=0.01%, 4=0.01%, 10=0.01%, 20=0.01%, 50=0.03%
  lat (msec)   : 100=0.01%, 250=0.01%, 500=0.01%
  cpu          : usr=4.79%, sys=12.52%, ctx=171263, majf=0, minf=36
  IO depths    : 1=100.0%, 2=0.0%, 4=0.0%, 8=0.0%, 16=0.0%, 32=0.0%, >=64=0.0%
     submit    : 0=0.0%, 4=100.0%, 8=0.0%, 16=0.0%, 32=0.0%, 64=0.0%, >=64=0.0%
     complete  : 0=0.0%, 4=100.0%, 8=0.0%, 16=0.0%, 32=0.0%, 64=0.0%, >=64=0.0%
     issued rwts: total=85804,85461,0,0 short=0,0,0,0 dropped=0,0,0,0
     latency   : target=0, window=0, percentile=100.00%, depth=64

Run status group 0 (all jobs):
   READ: bw=15.0MiB/s (16.7MB/s), 15.0MiB/s-15.0MiB/s (16.7MB/s-16.7MB/s), io=518MiB (543MB), run=32459-32459msec
  WRITE: bw=15.6MiB/s (16.4MB/s), 15.6MiB/s-15.6MiB/s (16.4MB/s-16.4MB/s), io=506MiB (531MB), run=32459-32459msec

Disk stats (read/write):
  vda: ios=85701/85498, merge=0/34, ticks=11506/17166, in_queue=28672, util=99.78%

===================================================================

direct sync

iometer: (g=0): rw=randrw, bs=(R) 512B-64.0KiB, (W) 512B-64.0KiB, (T) 512B-64.0KiB, ioengine=psync, iodepth=64
fio-3.7
Starting 1 process
Jobs: 1 (f=3): [m(1)][100.0%][r=9873KiB/s,w=9.85MiB/s][r=2326,w=2311 IOPS][eta 00m:00s]
iometer: (groupid=0, jobs=1): err= 0: pid=1024: Sun Oct 24 22:01:57 2021
  Description  : [Emulation of Intel IOmeter File Server Access Pattern]
   read: IOPS=2588, BW=15.6MiB/s (16.4MB/s)(518MiB/33143msec)
    clat (usec): min=101, max=2854, avg=153.73, stdev=51.58
     lat (usec): min=103, max=2855, avg=155.67, stdev=52.05
    clat percentiles (usec):
     |  1.00th=[  109],  5.00th=[  115], 10.00th=[  118], 20.00th=[  123],
     | 30.00th=[  126], 40.00th=[  133], 50.00th=[  141], 60.00th=[  147],
     | 70.00th=[  155], 80.00th=[  169], 90.00th=[  215], 95.00th=[  260],
     | 99.00th=[  334], 99.50th=[  375], 99.90th=[  519], 99.95th=[  660],
     | 99.99th=[ 1045]
   bw (  KiB/s): min= 8901, max=29142, per=100.00%, avg=16021.95, stdev=4651.25, samples=66
   iops        : min= 1870, max= 3118, avg=2589.53, stdev=300.89, samples=66
  write: IOPS=2578, BW=15.3MiB/s (16.0MB/s)(506MiB/33143msec)
    clat (usec): min=119, max=123840, avg=214.82, stdev=1482.62
     lat (usec): min=121, max=123842, avg=216.99, stdev=1482.65
    clat percentiles (usec):
     |  1.00th=[  127],  5.00th=[  133], 10.00th=[  137], 20.00th=[  143],
     | 30.00th=[  147], 40.00th=[  153], 50.00th=[  163], 60.00th=[  174],
     | 70.00th=[  182], 80.00th=[  194], 90.00th=[  241], 95.00th=[  289],
     | 99.00th=[  367], 99.50th=[  424], 99.90th=[ 5866], 99.95th=[29492],
     | 99.99th=[80217]
   bw (  KiB/s): min= 9162, max=26677, per=100.00%, avg=15655.61, stdev=4532.61, samples=66
   iops        : min= 1860, max= 3100, avg=2577.86, stdev=315.86, samples=66
  lat (usec)   : 250=92.52%, 500=7.29%, 750=0.10%, 1000=0.02%
  lat (msec)   : 2=0.01%, 4=0.01%, 10=0.01%, 20=0.01%, 50=0.02%
  lat (msec)   : 100=0.01%, 250=0.01%
  cpu          : usr=4.74%, sys=11.81%, ctx=171269, majf=0, minf=36
  IO depths    : 1=100.0%, 2=0.0%, 4=0.0%, 8=0.0%, 16=0.0%, 32=0.0%, >=64=0.0%
     submit    : 0=0.0%, 4=100.0%, 8=0.0%, 16=0.0%, 32=0.0%, 64=0.0%, >=64=0.0%
     complete  : 0=0.0%, 4=100.0%, 8=0.0%, 16=0.0%, 32=0.0%, 64=0.0%, >=64=0.0%
     issued rwts: total=85804,85461,0,0 short=0,0,0,0 dropped=0,0,0,0
     latency   : target=0, window=0, percentile=100.00%, depth=64

Run status group 0 (all jobs):
   READ: bw=15.6MiB/s (16.4MB/s), 15.6MiB/s-15.6MiB/s (16.4MB/s-16.4MB/s), io=518MiB (543MB), run=33143-33143msec
  WRITE: bw=15.3MiB/s (16.0MB/s), 15.3MiB/s-15.3MiB/s (16.0MB/s-16.0MB/s), io=506MiB (531MB), run=33143-33143msec

Disk stats (read/write):
  vda: ios=85795/85513, merge=0/20, ticks=11798/16745, in_queue=28543, util=99.74%

===============================================================

write through

iometer: (g=0): rw=randrw, bs=(R) 512B-64.0KiB, (W) 512B-64.0KiB, (T) 512B-64.0KiB, ioengine=psync, iodepth=64
fio-3.7
Starting 1 process
Jobs: 1 (f=3): [m(1)][100.0%][r=13.8MiB/s,w=14.2MiB/s][r=3275,w=3321 IOPS][eta 00m:00s]
iometer: (groupid=0, jobs=1): err= 0: pid=1025: Sun Oct 24 22:03:47 2021
  Description  : [Emulation of Intel IOmeter File Server Access Pattern]
   read: IOPS=2467, BW=14.9MiB/s (15.6MB/s)(518MiB/34776msec)
    clat (usec): min=28, max=2270, avg=105.88, stdev=76.86
     lat (usec): min=30, max=2272, avg=107.86, stdev=77.07
    clat percentiles (usec):
     |  1.00th=[   35],  5.00th=[   36], 10.00th=[   37], 20.00th=[   38],
     | 30.00th=[   40], 40.00th=[   43], 50.00th=[   81], 60.00th=[  135],
     | 70.00th=[  151], 80.00th=[  165], 90.00th=[  194], 95.00th=[  241],
     | 99.00th=[  330], 99.50th=[  371], 99.90th=[  482], 99.95th=[  570],
     | 99.99th=[  971]
   bw (  KiB/s): min= 9946, max=20245, per=99.96%, avg=15240.57, stdev=2279.39, samples=69
   iops        : min= 1582, max= 3690, avg=2457.10, stdev=587.94, samples=69
  write: IOPS=2457, BW=14.6MiB/s (15.3MB/s)(506MiB/34776msec)
    clat (usec): min=135, max=78912, avg=281.99, stdev=1239.11
     lat (usec): min=136, max=78913, avg=284.13, stdev=1239.15
    clat percentiles (usec):
     |  1.00th=[  147],  5.00th=[  151], 10.00th=[  157], 20.00th=[  165],
     | 30.00th=[  178], 40.00th=[  192], 50.00th=[  210], 60.00th=[  245],
     | 70.00th=[  285], 80.00th=[  330], 90.00th=[  375], 95.00th=[  424],
     | 99.00th=[  570], 99.50th=[  644], 99.90th=[ 9110], 99.95th=[28443],
     | 99.99th=[63177]
   bw (  KiB/s): min= 9128, max=20043, per=99.95%, avg=14897.84, stdev=2082.27, samples=69
   iops        : min= 1570, max= 3638, avg=2447.70, stdev=574.29, samples=69
  lat (usec)   : 50=23.06%, 100=2.41%, 250=53.12%, 500=20.28%, 750=0.99%
  lat (usec)   : 1000=0.06%
  lat (msec)   : 2=0.02%, 4=0.01%, 10=0.01%, 20=0.01%, 50=0.02%
  lat (msec)   : 100=0.01%
  cpu          : usr=4.38%, sys=11.16%, ctx=171251, majf=0, minf=36
  IO depths    : 1=100.0%, 2=0.0%, 4=0.0%, 8=0.0%, 16=0.0%, 32=0.0%, >=64=0.0%
     submit    : 0=0.0%, 4=100.0%, 8=0.0%, 16=0.0%, 32=0.0%, 64=0.0%, >=64=0.0%
     complete  : 0=0.0%, 4=100.0%, 8=0.0%, 16=0.0%, 32=0.0%, 64=0.0%, >=64=0.0%
     issued rwts: total=85804,85461,0,0 short=0,0,0,0 dropped=0,0,0,0
     latency   : target=0, window=0, percentile=100.00%, depth=64

Run status group 0 (all jobs):
   READ: bw=14.9MiB/s (15.6MB/s), 14.9MiB/s-14.9MiB/s (15.6MB/s-15.6MB/s), io=518MiB (543MB), run=34776-34776msec
  WRITE: bw=14.6MiB/s (15.3MB/s), 14.6MiB/s-14.6MiB/s (15.3MB/s-15.3MB/s), io=506MiB (531MB), run=34776-34776msec

Disk stats (read/write):
  vda: ios=85360/85041, merge=0/18, ticks=7406/22572, in_queue=29978, util=99.75%

================================================================

write back

iometer: (g=0): rw=randrw, bs=(R) 512B-64.0KiB, (W) 512B-64.0KiB, (T) 512B-64.0KiB, ioengine=psync, iodepth=64
fio-3.7
Starting 1 process
Jobs: 1 (f=3): [m(1)][100.0%][r=29.4MiB/s,w=29.9MiB/s][r=6976,w=7009 IOPS][eta 00m:00s]
iometer: (groupid=0, jobs=1): err= 0: pid=1021: Sun Oct 24 22:05:06 2021
  Description  : [Emulation of Intel IOmeter File Server Access Pattern]
   read: IOPS=3871, BW=23.4MiB/s (24.5MB/s)(518MiB/22164msec)
    clat (usec): min=28, max=12350, avg=112.79, stdev=135.36
     lat (usec): min=30, max=12352, avg=114.83, stdev=135.55
    clat percentiles (usec):
     |  1.00th=[   35],  5.00th=[   37], 10.00th=[   38], 20.00th=[   41],
     | 30.00th=[   43], 40.00th=[   46], 50.00th=[   69], 60.00th=[  139],
     | 70.00th=[  157], 80.00th=[  178], 90.00th=[  212], 95.00th=[  262],
     | 99.00th=[  363], 99.50th=[  412], 99.90th=[  603], 99.95th=[  938],
     | 99.99th=[ 5342]
   bw (  KiB/s): min=10682, max=31639, per=100.00%, avg=23930.39, stdev=4126.10, samples=44
   iops        : min= 2212, max= 7366, avg=3861.02, stdev=1436.84, samples=44
  write: IOPS=3855, BW=22.8MiB/s (23.9MB/s)(506MiB/22164msec)
    clat (usec): min=36, max=203000, avg=126.42, stdev=930.79
     lat (usec): min=38, max=203002, avg=128.86, stdev=930.84
    clat percentiles (usec):
     |  1.00th=[   44],  5.00th=[   47], 10.00th=[   49], 20.00th=[   52],
     | 30.00th=[   55], 40.00th=[   58], 50.00th=[   62], 60.00th=[   97],
     | 70.00th=[  153], 80.00th=[  215], 90.00th=[  258], 95.00th=[  285],
     | 99.00th=[  388], 99.50th=[  441], 99.90th=[  693], 99.95th=[ 1221],
     | 99.99th=[15270]
   bw (  KiB/s): min=10302, max=32041, per=100.00%, avg=23399.55, stdev=4090.09, samples=44
   iops        : min= 2148, max= 7414, avg=3846.48, stdev=1417.26, samples=44
  lat (usec)   : 50=28.96%, 100=27.75%, 250=34.74%, 500=8.33%, 750=0.15%
  lat (usec)   : 1000=0.02%
  lat (msec)   : 2=0.02%, 4=0.01%, 10=0.01%, 20=0.01%, 50=0.01%
  lat (msec)   : 250=0.01%
  cpu          : usr=7.40%, sys=17.75%, ctx=171252, majf=0, minf=36
  IO depths    : 1=100.0%, 2=0.0%, 4=0.0%, 8=0.0%, 16=0.0%, 32=0.0%, >=64=0.0%
     submit    : 0=0.0%, 4=100.0%, 8=0.0%, 16=0.0%, 32=0.0%, 64=0.0%, >=64=0.0%
     complete  : 0=0.0%, 4=100.0%, 8=0.0%, 16=0.0%, 32=0.0%, 64=0.0%, >=64=0.0%
     issued rwts: total=85804,85461,0,0 short=0,0,0,0 dropped=0,0,0,0
     latency   : target=0, window=0, percentile=100.00%, depth=64

Run status group 0 (all jobs):
   READ: bw=23.4MiB/s (24.5MB/s), 23.4MiB/s-23.4MiB/s (24.5MB/s-24.5MB/s), io=518MiB (543MB), run=22164-22164msec
  WRITE: bw=22.8MiB/s (23.9MB/s), 22.8MiB/s-22.8MiB/s (23.9MB/s-23.9MB/s), io=506MiB (531MB), run=22164-22164msec

Disk stats (read/write):
  vda: ios=85645/85340, merge=0/17, ticks=8026/10446, in_queue=18472, util=99.52%


前三個模式沒有太大的差異
但 write back 效能不管是讀或寫
都快了 1.5倍以上

做為參考


最近有個朋友問到如何用python走rest api 撈graylog的資料

因為一直以來都是用curl

沒用python

今天朋友說他試出來了 感謝他的分享

做個記錄


程式碼如下


import requests


user = 'admin'

pw = 'pwd'

send_format_date_from = '2021-10-21T16:00:00.000Z'

send_format_date_to = '2021-10-21T17:00:00.000Z'

str = 'search key word'

url='http://graylog_ip:9000/api/views/search/messages'

header = {'Accept':'text/csv,application/json', 'Content-Type':'application/json', 'X-Requested-By':'cli'}


#以下是使用絶對時間的語法 上方已定義區間

graylog_send_data={ "streams":["000000000000000000000001"], "timerange":[ "absolute",{ "from":send_format_date_from, "to":send_format_date_to } ], "query_string":{ "type":"elasticsearch", "query_string":str } }


#以下是使用相對時間的語法 range 是以秒為單位

graylog_send_data={ "streams":["000000000000000000000001"], "timerange":{ "type":"relative","range":60 }, "query_string":{ "type":"elasticsearch", "query_string":str } }


r = requests.post(url, auth=(user, pw), headers=header, json=graylog_send_data)


print(r.text)


相對時間或絶對時間擇一使用

2021/10/21

升到 promox 7 後

有几台guest都出現了以下的問題


可是使用  badblocks xfs_repair  進行檢查

都沒有發現任何錯誤

而且看了一下nas各個HD的資訊

也沒有發現任何狀況

還在找原因

之前有一台是發生在swap 區

目前把swap 關掉

然後把 ram 從2G調到 4G

觀察到現在沒有異常

不知道是不是ram 的問題


2021/10/24 更新

發生狀況的有四台几器 共同的情況是這些guest的io都很大

分別處理如下

ntopng因為升版後 system id 變了 所以移至 LXC 後 重新要了新key

librenms 下載了新版的vm 把資料移轉到新几器上

https://docs.librenms.org/Support/FAQ/#how-do-i-move-my-librenms-install-to-another-server


剩下cacti 跟 syslog

從log來看是 write 時候的問題

目前所有的guest hd 預設都是使用 no cache

想說會不會是效能的問題

https://adminkk.blogspot.com/2016/05/wsus-proxmox-winmount-nfs-wsus-iscsi.html


於是把上面二台

一台調成 write back

一台調成 write through

 到目前跑了二天

持續觀察中


2021/10/06


如何在synology的nas上憑証


2021/10/01

在synology的nas裝好 pbs後

要更新出現以下的錯誤


Err:4 http://download.proxmox.com/debian/pbs bullseye InRelease

  The following signatures couldn't be verified because the public key is not available: NO_PUBKEY DD4BA3917E23BF59

Reading package lists... Done

W: GPG error: http://download.proxmox.com/debian/pbs bullseye InRelease: The following signatures couldn't be verified because the public key is not available: NO_PUBKEY DD4BA3917E23BF59

E: The repository 'http://download.proxmox.com/debian/pbs bullseye InRelease' is not signed.

N: Updating from such a repository can't be done securely, and is therefore disabled by default.

N: See apt-secure(8) manpage for repository creation and user configuration details.


應該是GPG key 沒有裝

以下指令安裝

wget https://enterprise.proxmox.com/debian/proxmox-release-bullseye.gpg -O /etc/apt/trusted.gpg.d/proxmox-release-bullseye.gpg 


再update就沒問題了


https://pve.proxmox.com/wiki/Install_Proxmox_VE_on_Debian_11_Bullseye#Install_Proxmox_VE


今天有個user拿了一片DVD來

說要給其他看看

本來想說直接把檔案丟到google drive share出去就好

結果有保護

想說轉成MP4好了

試了很多軟体 最後  HandBrake 成功了

參考以下連結

https://ephrain.net/ubuntu-%E4%BD%BF%E7%94%A8-handbrake-%E5%B0%87-dvd-%E8%BD%89%E6%88%90-mp4/