2022/04/29

2022/04/18
昨天是舊憑証的到期日
所以今天要撈出那些ip已經上了新憑証
把封包導入解密
使用 nmap 查找憑証指令如下
#!/bin/bash
for i in {1..250}
do
echo $i
nmap -Pn --script ssl-cert -p 443 10.0.0.$i -oN ca_$i
done
若把執行結果餵到變數 注意以下不同
r=`nmap --script ssl-cert -p 443 10.0.0.$i|grep -E 'TWCA|after'`
echo $r > ca_$i #導出結果無換行
echo "$r" > ca_$i #導出結果有換行
使用 curl 程式如下
#!/bin/bash
for i in {1..250}
do
echo $i
curl -m 3 https://10.0.0.$i -k -v -s -o /dev/null 2> /tmp/ca/ca_$i
done
接下來再針對關鍵字及有無過期查找即可
2022/04/11
今天有朋友問greenbone的問題
到官網看了一下
名字又改了
改成 Greenbone Enterprise TRIAL
不過下載時看到的檔案還是GSM
只是比之前用的版本又更新了
順便記錄一下怎麼匯入 proxmox
ova下載回來後先解開
tar xvf GSM-TRIAL-21.04.15-VirtualBox.ova
https://www.greenbone.net/en/testnow/
2022/03/10
2022/02/13
2022/02/10
之前從centos 8 升到 centos 8 stream 的几器最近無法更新
出現以下訊息
[root@localhost ~]# dnf -y update
Failed to set locale, defaulting to C.UTF-8
CentOS Linux 8 - AppStream 51 B/s | 38 B 00:00
Error: Failed to download metadata for repo 'appstream': Cannot prepare internal mirrorlist: No URLs in mirrorlist
2022/01/18
2022/01/15
proxmox 目前有支援 metric server 把系統資料往外丟到
Graphite 或 InfluxDB


就可以利用grafana來畫圖
因為proxmox丟到influxdb只提供 udp http https 三種方式
而influxdb預設使用tcp
因此要修改 /etc/influxdb/influxdb.conf
加上
[[udp]]
    enabled = true
    bind-address = "0.0.0.0:8089"
    database = "proxmox"
    batch-size = 1000
    batch-timeout = "1s"
proxmox 上的設定如上圖
如果設定新 proxmox 的dashboard步驟如下先在influxdbcreate 新databasecreate database proxmox_new
再修改 /etc/influxdb/influxdb.conf
加上
[[udp]] enabled = true bind-address = "0.0.0.0:8090" database = "proxmox_new" batch-size = 1000 batch-timeout = "1s"注意藍字部分改完後重啟 influxdb接下來到proxmox主控台依上述的config進行設定再來設定grafana到 https://grafana.com/grafana/dashboards/10048/revisions 下載 proxmox_rev1.json修改 proxmox_rev1.json 內容 檔案最下方"title": "Proxmox_new", "uid": "kxQQuHRak",

改完後 import 時要選擇 upload json file 使用上述修改好的檔案

https://www.cxybb.com/article/caiyqn/106380171
https://www.linuxsysadmins.com/monitoring-proxmox-with-grafana/
2022/01/10
想在其他網頁上show出grafana的圖
查了一些資料
說到可以改為anonymous不登入
但感覺醬不太安全
最後決定使用api key的方式來處理
首先產生api key
登入後 在畫面左邊的齒輪(configuration)點進去 再點選 API keys


因為目前不支援整個dashboard的render 只能單一panel
所以在panel上方點出選項然後再點下 share

因為沒有安裝 renderer 所以出現以下訊息

以下指令安裝
grafana-cli plugins install grafana-image-renderer
安裝後就會出現
direct link rendered image 的連結
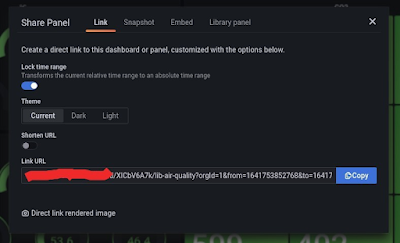
但點下去之後出現

無法畫圖
查了一下log
要在OS補上以下的package
yum install -y atk
yum install -y at-spi2-atk
yum install -y cups-libs
yum install -y libdrm
yum install -y libxkbcommon
yum install -y libXcomposite
yum install -y libXdamage
yum install -y mesa-libgbm
yum install -y pango
yum install -y alsa-lib
補好再點就會出現圖了
些時就可以使用 api key把圖捉出來了
curl 使用的連結就是 direct link rendered image 的連結
以下語法是取出10分鐘前到現在的資料
curl -H "Authorization: Bearer your api key" "http://10.0.0.1:3000/render/d-solo/XICbV6A7k/lib-air-quality?orgId=1&from=now-10m&to=now&panelId=6&width=1000&height=500&tz=Asia%2FTaipei" > output.png
2022/01/01
本次弱掃出現很多台几器有相同的問題
Vulnerability Detection Result
'Vulnerable' cipher suites accepted by this service via the TLSv1.0 protocol:
TLS_DHE_RSA_WITH_3DES_EDE_CBC_SHA (SWEET32)
TLS_ECDHE_RSA_WITH_3DES_EDE_CBC_SHA (SWEET32)
TLS_RSA_WITH_3DES_EDE_CBC_SHA (SWEET32)
'Vulnerable' cipher suites accepted by this service via the TLSv1.1 protocol:
TLS_DHE_RSA_WITH_3DES_EDE_CBC_SHA (SWEET32)
TLS_ECDHE_RSA_WITH_3DES_EDE_CBC_SHA (SWEET32)
TLS_RSA_WITH_3DES_EDE_CBC_SHA (SWEET32)
'Vulnerable' cipher suites accepted by this service via the TLSv1.2 protocol:
TLS_DHE_RSA_WITH_3DES_EDE_CBC_SHA (SWEET32)
TLS_ECDHE_RSA_WITH_3DES_EDE_CBC_SHA (SWEET32)
TLS_RSA_WITH_3DES_EDE_CBC_SHA (SWEET32)
處理方法如下
vi /etc/httpd/conf.d
修改如下
#SSLProtocol all -SSLv2 -SSLv3
SSLProtocol all -SSLv2 -SSLv3 -TLSv1 -TLSv1.1
# SSL Cipher Suite:
# List the ciphers that the client is permitted to negotiate.
# See the mod_ssl documentation for a complete list.
#SSLCipherSuite HIGH:3DES:!aNULL:!MD5:!SEED:!IDEA
SSLCipherSuite HIGH:!3DES:!aNULL:!MD5:!SEED:!IDEA
改完後 restart
systemctl restart httpd
以nmap進行測試
nmap --script ssl-enum-ciphers -p 443 10.0.0.1
Starting Nmap 7.80 ( https://nmap.org ) at 2022-01-01 13:54 CST
Nmap scan report for www.nkuht.edu.tw (10.0.0.1)
Host is up (0.00029s latency).
PORT STATE SERVICE
443/tcp open https
| ssl-enum-ciphers:
| TLSv1.2:
| ciphers:
| TLS_ECDHE_RSA_WITH_AES_256_GCM_SHA384 (secp256r1) - A
| TLS_ECDHE_RSA_WITH_AES_128_GCM_SHA256 (secp256r1) - A
| TLS_DHE_RSA_WITH_AES_256_GCM_SHA384 (dh 2048) - A
| TLS_DHE_RSA_WITH_AES_128_GCM_SHA256 (dh 2048) - A
| TLS_ECDHE_RSA_WITH_AES_256_CBC_SHA384 (secp256r1) - A
| TLS_ECDHE_RSA_WITH_AES_256_CBC_SHA (secp256r1) - A
| TLS_DHE_RSA_WITH_AES_256_CBC_SHA256 (dh 2048) - A
| TLS_DHE_RSA_WITH_AES_256_CBC_SHA (dh 2048) - A
| TLS_ECDHE_RSA_WITH_AES_128_CBC_SHA256 (secp256r1) - A
| TLS_ECDHE_RSA_WITH_AES_128_CBC_SHA (secp256r1) - A
| TLS_DHE_RSA_WITH_AES_128_CBC_SHA256 (dh 2048) - A
| TLS_DHE_RSA_WITH_AES_128_CBC_SHA (dh 2048) - A
| TLS_RSA_WITH_AES_256_GCM_SHA384 (rsa 2048) - A
| TLS_RSA_WITH_AES_128_GCM_SHA256 (rsa 2048) - A
| TLS_RSA_WITH_AES_256_CBC_SHA256 (rsa 2048) - A
| TLS_RSA_WITH_AES_256_CBC_SHA (rsa 2048) - A
| TLS_RSA_WITH_AES_128_CBC_SHA256 (rsa 2048) - A
| TLS_RSA_WITH_AES_128_CBC_SHA (rsa 2048) - A
| compressors:
| NULL
| cipher preference: server
|_ least strength: A
Nmap done: 1 IP address (1 host up) scanned in 0.58 seconds
2021/11/05
2021/11/02
有個guest在備分時偶爾會出現以下的錯誤
怪的狀況不是每天
而是不定時會發生

109: 2021-11-01 23:34:40 INFO: Starting Backup of VM 109 (qemu)
109: 2021-11-01 23:34:40 INFO: status = running
109: 2021-11-01 23:34:40 INFO: VM Name: 0.226-examtest
109: 2021-11-01 23:34:40 INFO: include disk 'virtio0' 'nfs218_system:109/vm-109-disk-0.qcow2' 100G
109: 2021-11-01 23:34:40 INFO: backup mode: snapshot
109: 2021-11-01 23:34:40 INFO: ionice priority: 7
109: 2021-11-01 23:34:40 INFO: creating Proxmox Backup Server archive 'vm/109/2021-11-01T15:34:40Z'
109: 2021-11-01 23:34:41 INFO: started backup task '2ba8928b-bd3b-4e90-a62f-7fd1a37d51d8'
109: 2021-11-01 23:34:41 INFO: resuming VM again
109: 2021-11-01 23:34:44 ERROR: VM 109 qmp command 'cont' failed - got timeout
109: 2021-11-01 23:34:44 INFO: aborting backup job
109: 2021-11-01 23:34:44 INFO: resuming VM again
109: 2021-11-01 23:34:44 ERROR: Backup of VM 109 failed - VM 109 qmp command 'cont' failed - got timeout
2021/10/31
proxmox更新到7版後
在管理介面 mount nfs 可以選 v3 或 v4

用fio測一下 v3 和 v4 的效能差別
config 如下
# This job file tries to mimic the Intel IOMeter File Server Access Pattern
[global]
description=Emulation of Intel IOmeter File Server Access Pattern
[iometer]
bssplit=512/10:1k/5:2k/5:4k/60:8k/2:16k/4:32k/4:64k/10
filename=PhysicalDrive1:PhysicalDrive2:PhysicalDrive3
size=10G
rw=randrw
#set read 50% write 50%
rwmixread=50
direct=1
runtime=60
# IOMeter defines the server loads as the following:
# iodepth=1 Linear
# iodepth=4 Very Light
# iodepth=8 Light
# iodepth=64 Moderate
# iodepth=256 Heavy
iodepth=64
測三次 取最後一次的值如下
nfs v4
iometer: (g=0): rw=randrw, bs=(R) 512B-64.0KiB, (W) 512B-64.0KiB, (T) 512B-64.0KiB, ioengine=psync, iodepth=64
fio-3.25
Starting 1 process
Jobs: 1 (f=3): [m(1)][100.0%][r=168KiB/s,w=107KiB/s][r=11,w=12 IOPS][eta 00m:00s]
iometer: (groupid=0, jobs=1): err= 0: pid=2342174: Sun Oct 31 07:28:44 2021
Description : [Emulation of Intel IOmeter File Server Access Pattern]
read: IOPS=55, BW=610KiB/s (625kB/s)(35.7MiB/60016msec)
clat (usec): min=430, max=339828, avg=10019.94, stdev=13081.64
lat (usec): min=431, max=339828, avg=10020.43, stdev=13081.64
clat percentiles (usec):
| 1.00th=[ 775], 5.00th=[ 3228], 10.00th=[ 4015], 20.00th=[ 5473],
| 30.00th=[ 6587], 40.00th=[ 7832], 50.00th=[ 9110], 60.00th=[ 10159],
| 70.00th=[ 11338], 80.00th=[ 12387], 90.00th=[ 13304], 95.00th=[ 14222],
| 99.00th=[ 43254], 99.50th=[ 99091], 99.90th=[208667], 99.95th=[299893],
| 99.99th=[341836]
bw ( KiB/s): min= 72, max= 1180, per=100.00%, avg=613.90, stdev=270.71, samples=119
iops : min= 8, max= 90, avg=56.03, stdev=18.14, samples=119
write: IOPS=57, BW=592KiB/s (606kB/s)(34.7MiB/60016msec); 0 zone resets
clat (usec): min=316, max=218978, avg=7624.96, stdev=11376.82
lat (usec): min=316, max=218979, avg=7626.12, stdev=11376.98
clat percentiles (usec):
| 1.00th=[ 400], 5.00th=[ 457], 10.00th=[ 490], 20.00th=[ 586],
| 30.00th=[ 1172], 40.00th=[ 4113], 50.00th=[ 6128], 60.00th=[ 8094],
| 70.00th=[ 10028], 80.00th=[ 11994], 90.00th=[ 13960], 95.00th=[ 18482],
| 99.00th=[ 37487], 99.50th=[ 85459], 99.90th=[152044], 99.95th=[212861],
| 99.99th=[219153]
bw ( KiB/s): min= 18, max= 1278, per=100.00%, avg=595.21, stdev=271.81, samples=119
iops : min= 6, max= 106, avg=58.24, stdev=19.98, samples=119
lat (usec) : 500=6.12%, 750=8.19%, 1000=1.17%
lat (msec) : 2=1.67%, 4=7.70%, 10=39.02%, 20=33.10%, 50=2.17%
lat (msec) : 100=0.41%, 250=0.41%, 500=0.03%
cpu : usr=0.16%, sys=0.57%, ctx=6838, majf=0, minf=14
IO depths : 1=100.0%, 2=0.0%, 4=0.0%, 8=0.0%, 16=0.0%, 32=0.0%, >=64=0.0%
submit : 0=0.0%, 4=100.0%, 8=0.0%, 16=0.0%, 32=0.0%, 64=0.0%, >=64=0.0%
complete : 0=0.0%, 4=100.0%, 8=0.0%, 16=0.0%, 32=0.0%, 64=0.0%, >=64=0.0%
issued rwts: total=3339,3476,0,0 short=0,0,0,0 dropped=0,0,0,0
latency : target=0, window=0, percentile=100.00%, depth=64
Run status group 0 (all jobs):
READ: bw=610KiB/s (625kB/s), 610KiB/s-610KiB/s (625kB/s-625kB/s), io=35.7MiB (37.5MB), run=60016-60016msec
WRITE: bw=592KiB/s (606kB/s), 592KiB/s-592KiB/s (606kB/s-606kB/s), io=34.7MiB (36.4MB), run=60016-60016msec
nfs v3
iometer: (g=0): rw=randrw, bs=(R) 512B-64.0KiB, (W) 512B-64.0KiB, (T) 512B-64.0KiB, ioengine=psync, iodepth=64
fio-3.25
Starting 1 process
Jobs: 1 (f=3): [m(1)][100.0%][r=581KiB/s,w=609KiB/s][r=51,w=42 IOPS][eta 00m:00s]
iometer: (groupid=0, jobs=1): err= 0: pid=2347167: Sun Oct 31 07:35:09 2021
Description : [Emulation of Intel IOmeter File Server Access Pattern]
read: IOPS=49, BW=548KiB/s (561kB/s)(32.1MiB/60012msec)
clat (usec): min=394, max=285769, avg=9756.36, stdev=10269.42
lat (usec): min=394, max=285770, avg=9756.86, stdev=10269.42
clat percentiles (usec):
| 1.00th=[ 889], 5.00th=[ 3294], 10.00th=[ 4113], 20.00th=[ 5407],
| 30.00th=[ 6718], 40.00th=[ 7898], 50.00th=[ 8979], 60.00th=[ 10290],
| 70.00th=[ 11338], 80.00th=[ 12387], 90.00th=[ 13435], 95.00th=[ 14484],
| 99.00th=[ 30278], 99.50th=[ 56361], 99.90th=[206570], 99.95th=[233833],
| 99.99th=[287310]
bw ( KiB/s): min= 8, max= 1118, per=100.00%, avg=548.19, stdev=256.60, samples=119
iops : min= 2, max= 86, avg=49.50, stdev=15.73, samples=119
write: IOPS=51, BW=522KiB/s (534kB/s)(30.6MiB/60012msec); 0 zone resets
clat (usec): min=357, max=221586, avg=10035.07, stdev=12250.59
lat (usec): min=358, max=221587, avg=10036.14, stdev=12250.75
clat percentiles (usec):
| 1.00th=[ 482], 5.00th=[ 627], 10.00th=[ 1172], 20.00th=[ 4146],
| 30.00th=[ 5735], 40.00th=[ 7111], 50.00th=[ 8586], 60.00th=[ 10159],
| 70.00th=[ 11600], 80.00th=[ 13042], 90.00th=[ 16188], 95.00th=[ 21103],
| 99.00th=[ 47449], 99.50th=[ 93848], 99.90th=[168821], 99.95th=[196084],
| 99.99th=[221250]
bw ( KiB/s): min= 34, max= 1039, per=100.00%, avg=523.79, stdev=223.74, samples=119
iops : min= 6, max= 82, avg=51.63, stdev=15.50, samples=119
lat (usec) : 500=0.73%, 750=4.03%, 1000=0.87%
lat (msec) : 2=0.71%, 4=7.69%, 10=44.35%, 20=37.52%, 50=3.37%
lat (msec) : 100=0.38%, 250=0.33%, 500=0.02%
cpu : usr=0.25%, sys=0.59%, ctx=6076, majf=0, minf=15
IO depths : 1=100.0%, 2=0.0%, 4=0.0%, 8=0.0%, 16=0.0%, 32=0.0%, >=64=0.0%
submit : 0=0.0%, 4=100.0%, 8=0.0%, 16=0.0%, 32=0.0%, 64=0.0%, >=64=0.0%
complete : 0=0.0%, 4=100.0%, 8=0.0%, 16=0.0%, 32=0.0%, 64=0.0%, >=64=0.0%
issued rwts: total=2968,3090,0,0 short=0,0,0,0 dropped=0,0,0,0
latency : target=0, window=0, percentile=100.00%, depth=64
Run status group 0 (all jobs):
READ: bw=548KiB/s (561kB/s), 548KiB/s-548KiB/s (561kB/s-561kB/s), io=32.1MiB (33.7MB), run=60012-60012msec
WRITE: bw=522KiB/s (534kB/s), 522KiB/s-522KiB/s (534kB/s-534kB/s), io=30.6MiB (32.1MB), run=60012-60012msec
初步看起來 v4 稍微好一些
2021/10/24
[global]
description=Emulation of Intel IOmeter File Server Access Pattern
[iometer]
bssplit=512/10:1k/5:2k/5:4k/60:8k/2:16k/4:32k/4:64k/10
filename=\\.\PhysicalDrive1:\\.\PhysicalDrive2:\\.\PhysicalDrive3
size=1G
rw=randrw
#set read 50% write 50%
rwmixread=50
direct=1
runtime=60
# IOMeter defines the server loads as the following:
# iodepth=1 Linear
# iodepth=4 Very Light
# iodepth=8 Light
# iodepth=64 Moderate
# iodepth=256 Heavy
iodepth=64
最近有個朋友問到如何用python走rest api 撈graylog的資料
因為一直以來都是用curl
沒用python
今天朋友說他試出來了 感謝他的分享
做個記錄
程式碼如下
import requests
user = 'admin'
pw = 'pwd'
send_format_date_from = '2021-10-21T16:00:00.000Z'
send_format_date_to = '2021-10-21T17:00:00.000Z'
str = 'search key word'
url='http://graylog_ip:9000/api/views/search/messages'
header = {'Accept':'text/csv,application/json', 'Content-Type':'application/json', 'X-Requested-By':'cli'}
#以下是使用絶對時間的語法 上方已定義區間
graylog_send_data={ "streams":["000000000000000000000001"], "timerange":[ "absolute",{ "from":send_format_date_from, "to":send_format_date_to } ], "query_string":{ "type":"elasticsearch", "query_string":str } }
#以下是使用相對時間的語法 range 是以秒為單位
graylog_send_data={ "streams":["000000000000000000000001"], "timerange":{ "type":"relative","range":60 }, "query_string":{ "type":"elasticsearch", "query_string":str } }
r = requests.post(url, auth=(user, pw), headers=header, json=graylog_send_data)
print(r.text)
相對時間或絶對時間擇一使用
2021/10/21
升到 promox 7 後
有几台guest都出現了以下的問題

可是使用 badblocks xfs_repair 進行檢查
都沒有發現任何錯誤
而且看了一下nas各個HD的資訊
也沒有發現任何狀況
還在找原因
之前有一台是發生在swap 區
目前把swap 關掉
然後把 ram 從2G調到 4G
觀察到現在沒有異常
不知道是不是ram 的問題
2021/10/24 更新
發生狀況的有四台几器 共同的情況是這些guest的io都很大
分別處理如下
ntopng因為升版後 system id 變了 所以移至 LXC 後 重新要了新key
librenms 下載了新版的vm 把資料移轉到新几器上
https://docs.librenms.org/Support/FAQ/#how-do-i-move-my-librenms-install-to-another-server
剩下cacti 跟 syslog
從log來看是 write 時候的問題
目前所有的guest hd 預設都是使用 no cache
想說會不會是效能的問題
https://adminkk.blogspot.com/2016/05/wsus-proxmox-winmount-nfs-wsus-iscsi.html
於是把上面二台
一台調成 write back
一台調成 write through
到目前跑了二天
持續觀察中
2021/10/06


2021/10/01
在synology的nas裝好 pbs後
要更新出現以下的錯誤
Err:4 http://download.proxmox.com/debian/pbs bullseye InRelease
The following signatures couldn't be verified because the public key is not available: NO_PUBKEY DD4BA3917E23BF59
Reading package lists... Done
W: GPG error: http://download.proxmox.com/debian/pbs bullseye InRelease: The following signatures couldn't be verified because the public key is not available: NO_PUBKEY DD4BA3917E23BF59
E: The repository 'http://download.proxmox.com/debian/pbs bullseye InRelease' is not signed.
N: Updating from such a repository can't be done securely, and is therefore disabled by default.
N: See apt-secure(8) manpage for repository creation and user configuration details.
應該是GPG key 沒有裝
以下指令安裝
wget https://enterprise.proxmox.com/debian/proxmox-release-bullseye.gpg -O /etc/apt/trusted.gpg.d/proxmox-release-bullseye.gpg
再update就沒問題了
https://pve.proxmox.com/wiki/Install_Proxmox_VE_on_Debian_11_Bullseye#Install_Proxmox_VE
今天有個user拿了一片DVD來
說要給其他看看
本來想說直接把檔案丟到google drive share出去就好
結果有保護
想說轉成MP4好了
試了很多軟体 最後 HandBrake 成功了
參考以下連結
https://ephrain.net/ubuntu-%E4%BD%BF%E7%94%A8-handbrake-%E5%B0%87-dvd-%E8%BD%89%E6%88%90-mp4/